

1 引言
2 结果与讨论
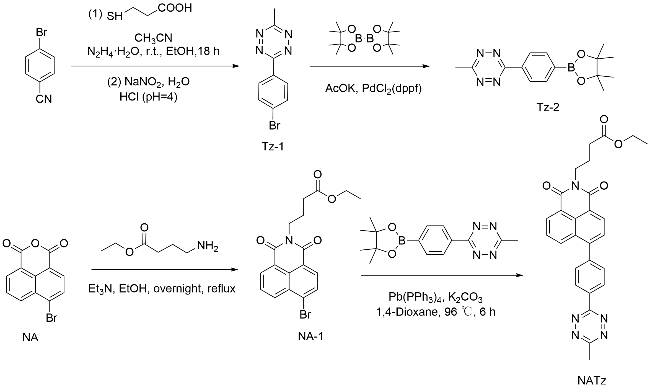
2.1 结构与合成
2.2 NATz的基本光物理性质
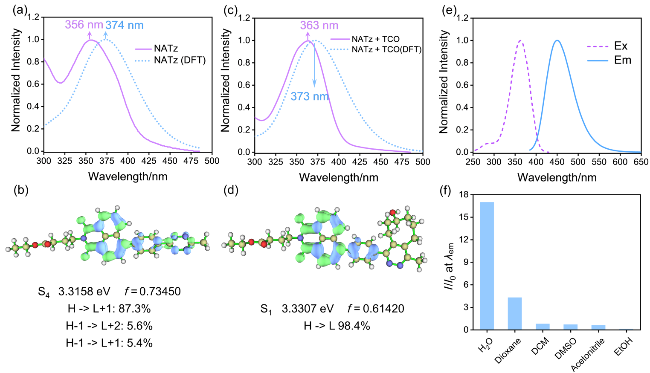
图1 (a)、(c)实测(实线)和模拟的(虚线)紫外光谱; NATz (b)和NATz-TCO (d)激发态的空穴电荷分布和前沿轨道贡献, 其中蓝色等值面代表空穴, 绿色等值面代表电荷. (e)与TCO反应后的NATz荧光光谱(实线)和激发光谱(虚线). (f)不同溶剂中与TCO反应后的NATz荧光强度(H->L表示HOMO能级至LUMO能级的跃迁)Figure 1 (a), (c) The measured (solid line) and calculated (dashed line) UV spectra; The hole charge distribution and frontier orbital contributions for the fourth excited state of NATz (b) and NATz-TCO (d) with blue isosurfaces representing holes and green isosurfaces representing charges. (e) The fluorescence spectrum (solid line) and excitation spectrum (dashed line) of NATz after the reaction with TCO. (f) The fluorescence intensity of NATz after reacting with TCO in different solvents (H->L represents the transition from the highest occupied molecular orbital (HOMO) to the lowest unoccupied molecular orbital (LUMO)) |
2.3 NATz的荧光淬灭与开启机理

图2 (a)通过前沿轨道能级差预测PET过程的概念图解; (b) NATz轨道能级差和电子分布示意图; (c) NATz激发态信息和前线轨道电子的相应分布; (d) NATz-TCO的激发态信息以及相应的前线轨道电子分布Figure 2 (a) Conceptual illustration predicting the PET process through the energy level difference of frontier orbitals; (b) Schematic diagram depicting the orbital energy level difference and electron distribution of NATz; (c) Depiction of NATz's excited state information and corresponding distributions of frontier orbital electrons; (d) Excited state information of NATz-TCO along with corresponding distributions of frontier orbital electrons |
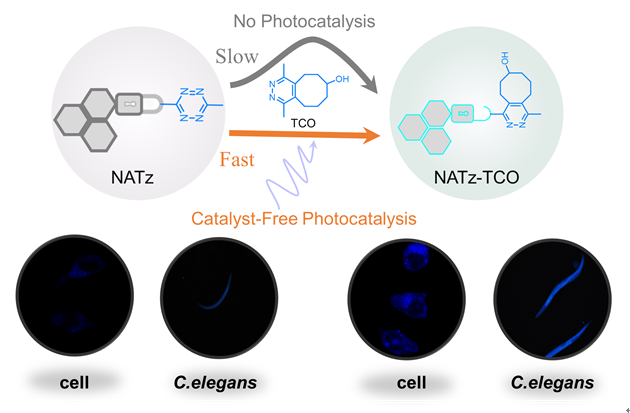
2.4 光介导生物正交反应发生
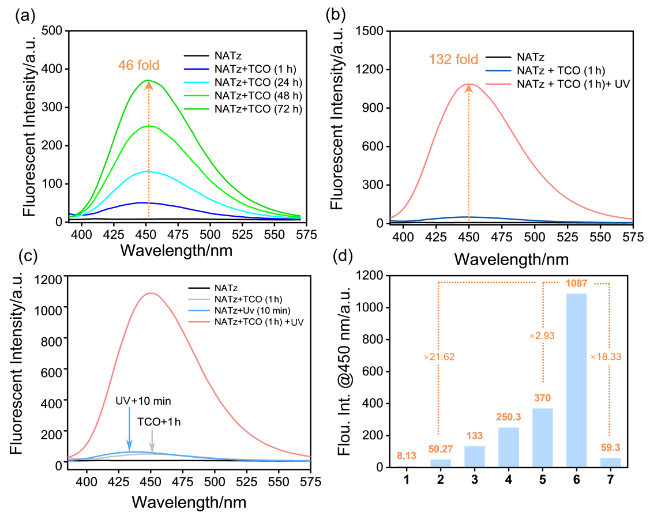
图3 (a)~(c)不同条件下NATz荧光光谱; (d) 不同条件下450 nm处NATz的荧光强度. 1: NATz; 2: NATz+TCO (1 h); 3: NATz+TCO (24 h); 4: NATz+TCO (48 h); 5: NATz+TCO (72 h); 6: NATz+TCO (1 h)+UV (10 min); 7: NATz+UV (10 min)Figure 3 (a)~(c) Fluorescence spectra of NATz under diverse conditions; (d) Fluorescence intensity at 450 nm under diverse conditions. 1: NATz, 2: NATz+TCO (1 h), 3: NATz+TCO (24 h), 4: NATz+TCO (48 h), 5: NATz+TCO (72 h), 6: NATz+TCO (1 h)+UV (10 min), 7: NATz+UV (10 min) |
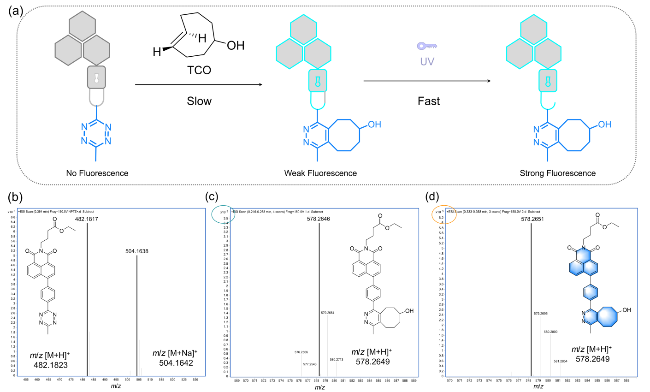
图4 (a) TCO和四氮嗪衍生物之间光介导反应的概念图; (b) NATz的高分辨率质谱; (c)与TCO反应1 h后NATz的高分辨率质谱; (d) NATz与TCO反应1 h加紫外线照射10 min后的高分辨率质谱Figure 4 (a) Conceptual diagram depicting the photocatalytic reaction between TCO and tetrazine; (b) High-resolution mass spectrum of NATz; (c) High-resolution mass spectrum of NATz after one hour of reaction with TCO; (d) High-resolution mass spectrum of NATz after one hour of reaction with TCO followed by 10 min of UV light exposure |
2.5 光介导生物正交反应机理
2.6 理论计算光介导生物正交机理
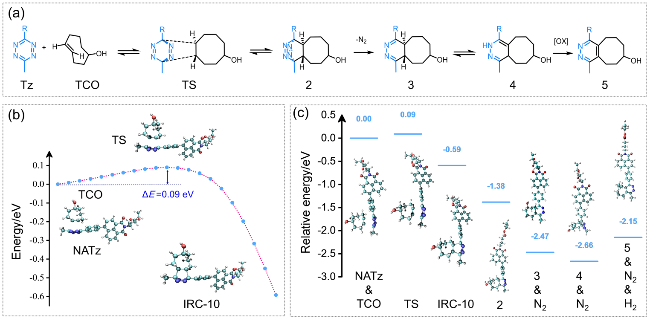
图5 (a)四嗪和TCO之间的IEDDA反应路径示意图; (b)四氮嗪衍生物与TCO环加成反应的过渡态和反应途径; (c)四氮嗪衍生物和TCO环加成过程中不同中间体的能量分布Figure 5 (a) Illustration of the IEDDA reaction pathway between tetrazine and TCO; (b) Transition states and reaction pathway for the cycloaddition reaction between tetrazine and TCO; (c) Energy profiles of different intermediates in the cycloaddition process of tetrazine and TCO |
2.7 光介导生物正交成像

图6 (a) NATz在HepG2细胞内的光介导正交成像; (b)秀丽隐杆线虫体内NATz的光介导正交成像; (c) NATz (40 μmol/L)的细胞毒性评价; (d)图(a)中细胞内平均荧光强度; (e)图(d)中线虫体内的平均荧光强度. 比例尺: 10 μm或200 μm. **: P<0.01, ***: P<0.001Figure 6 (a) Photocatalytic orthogonal imaging of NATz within HepG2 cells; (b) Photocatalytic orthogonal imaging of NATz inside the body of elegant hidden worms (C. elegans); (c) Cellular toxicity assessment of NATz (40 μmol/L); (d) Average fluorescence intensity within cells as depicted in (a); (e) Average fluorescence intensity within worms as shown in (d). scale bar: 10 μm/200 μm. **: P<0.01, ***: P<0.001 |
2.8 溶酶体靶向光介导生物正交成像
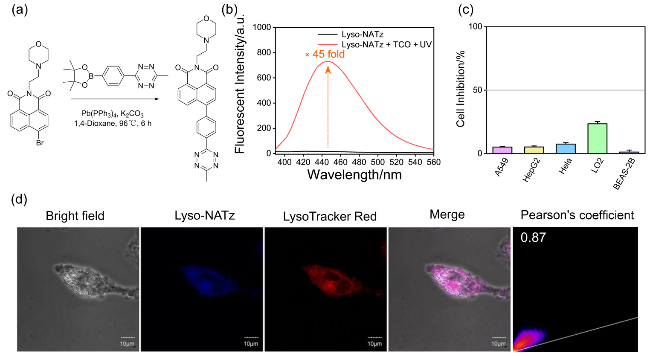
图7 (a) Lyso-NATz的合成路线; (b) Lyso-NATz光介导催化激活荧光光谱; (c) Lyso-NATz细胞毒性评价; (d) Lyso-NATz与溶酶体标记物的共定位成像(LysoTracker Red). 比例尺: 10 μmFigure 7 (a) Synthesis pathway of Lyso-NATz; (b) Photocatalytic orthogonal fluorescence spectra of Lyso-NATz; (c) Evaluation of cellular toxicity for Lyso-NATz; (d) Co-localization imaging of Lyso-NATz with lysosomal markers (LysoTracker Red). scale bar: 10 μm |