

1 引言
2 结果与讨论
2.1 表征结果
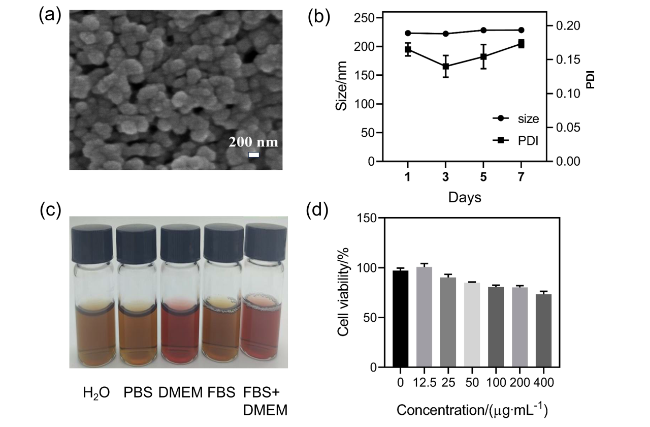
图1 GSH-Fe3-XSe3 NPs的表征结果. (a) SEM图; (b) 200 μg/mL GSH-Fe3-XSe3 NPs 7 d之内的水合粒径变化; (c)在不同溶液中的分散性; (d)不同浓度GSH-Fe3-XSe3 NPs对RAW264.7细胞的细胞毒性Figure 1 Characterization of GSH-Fe3-XSe3 NPs. (a) SEM image; (b) the hydrated particle size changes of 200 μg/mL GSH-Fe3-XSe3 NPs within 7 d; (c) dispersion of different solutions; (d) cytotoxicity of GSH-Fe3-XSe3 NPs at different concentrations on RAW264.7 cells |
2.2 体外抗炎抗氧化
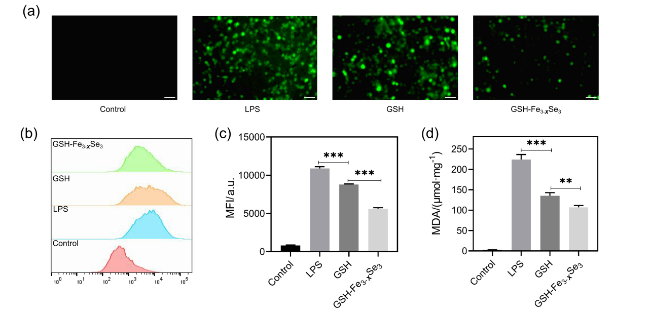
图3 体外抗氧化实验. (a)荧光显微镜检测RAW264.7细胞内200 μg/mL GSH和GSH-Fe3-XSe3 NPs的ROS清除能力(比例尺, 100 μm); (b)流式细胞仪分析检测200 μg/mL GSH, GSH-Fe3-XSe3 NPs清除RAW264.7中ROS的能力; (c)流式细胞仪定量分析(n=3); (d) GSH和GSH-Fe3-XSe3 NPs处理后, LPS刺激的RAW264.7细胞中的MDA含量. ** P<0.01, *** P<0.001Figure 3 In vitro antioxidant experiments. (a) Fluorescence microscopy detection of ROS scavenging capacity in RAW264.7 cells treated with 200 μg/mL GSH and GSH-Fe3-XSe3 NPs (scale bar, 100 μm); (b) flow cytometry analysis of ROS clearance in RAW264.7 cells by 200 μg/mL GSH, GSH- Fe3-XSe3 NPs; (c) quantitative analysis of flow cytometry results (n=3); (d) MDA levels in LPS-stimulated RAW264.7 cells after treatment with 200 μg/mL GSH, GSH-Fe3-XSe3 NPs. ** P<0.01, *** P<0.001 |

图4 200 μg/mL GSH和GSH-Fe3-XSe3 NPs处理后, LPS刺激的RAW264.7细胞中的(a) NO, (b)肿瘤转化因子α, (c)白介素6的含量; (d~f) Western blot检测RAW264.7细胞中P65、P-P65的蛋白表达水平及相对表达值. 针对内参基因进行归一化. * P<0.05, ** P<0.01, *** P<0.001, ns表示无显著差异Figure 4 Effects of 200 μg/mL GSH and GSH-Fe3-XSe3 NPs on LPS-stimulated RAW264.7 cells about (a) NO levels, (b) tumor necrosis factor-α (TNF-α) levels, and (c) Interleukin-6 (IL-6) levels in cell culture supernatants. (d~f) Western blot analysis of P65 and phosphorylated P65 (P-P65) protein expression levels in RAW264.7 cells, with relative expression values normalized to housekeeping genes. * P<0.05, ** P<0.01, *** P<0.001, ns indicates no significant difference |
2.3 体内治疗急性肾损伤
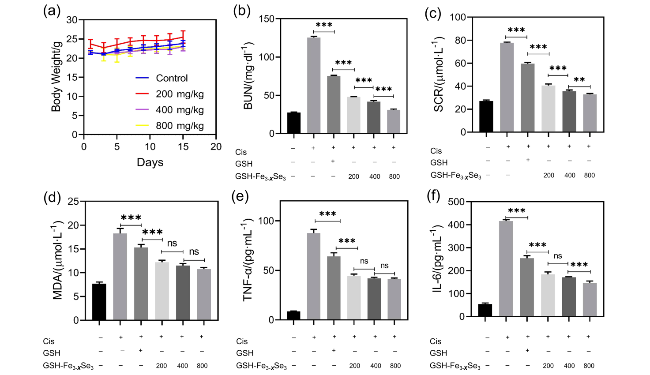
图5 体内实验. (a)治疗期间(15 d)小鼠的体重变化, n=3 ; GSH (800 mg/kg)和不同浓度GSH-Fe3-XSe3 NPs处理后, 不同组小鼠的(b)尿氮, (c)肌酐, (d)丙二醛, (e)肿瘤转化因子α, (f)白介素6水平. n=5. ** P<0.01, *** P<0.001, ns表示无显著差异Figure 5 In vivo experiment. (a) Body weight changes of mice during the treatment period (15 d), n=3; levels of (b) blood urea nitrogen (BUN), (c) creatinine, (d) malondialdehyde (MDA), (e) tumor necrosis factor-α (TNF-α), (f) interleukin-6 (IL-6) in different groups of mice after treatment with GSH (800 mg/kg) and GSH-Fe3-XSe3 NPs of different concentrations, n=5. ** P<0.01, *** P<0.001, ns indicates no significant difference |
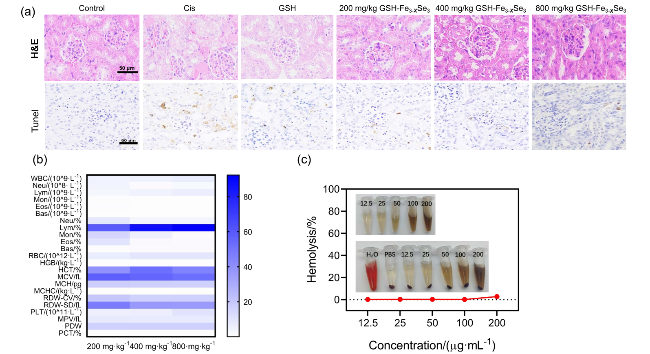
图6 (a)不同剂量GSH-Fe3-XSe3 NPs、800 mg/kg GSH或PBS处理的AKI小鼠的肾脏进行H&E染色和Tunel染色; (b)不同浓度GSH-Fe3-XSe3 NPs对正常小鼠的血常规分析, n=3; (c) GSH-Fe3-XSe3 NPs的体外溶血实验Figure 6 (a) H&E staining and Tunel staining of kidneys from AKI mice treated with different doses of GSH-Fe3-XSe3 NPs, 800 mg/kg GSH or PBS; (b) complete blood count analysis of normal mice treated with different concentrations of GSH-Fe3-XSe3 NPs (n=3); (c) in vitro hemolysis assay of GSH-Fe3-XSe3 NPs |