


1 引言
2 结果与讨论
2.1 Ti-MOFs的结构与表征

图1 (a) MOF-901和MOF-902的合成示意图; (b) MOF-901和MOF-902的模拟与实验PXRD图; (c) FTIR图; (d) N2吸附/脱附等温线; (e) MOF-901的SEM图; (f) MOF-902的SEM图; (g) TGA曲线Figure 1 (a) Synthesis schematic of MOF-901 and MOF-902; (b) Simulated and experimental PXRD patterns of MOF-901 and MOF-902; (c) FT-IR; (d) Nitrogen adsorption/desorption isotherms; (e) SEM image of MOF-901; (f) SEM image of MOF-902; (g) TGA curve |
2.2 Ti-MOFs对$UO_{2}^{2+}$的吸附性能研究
2.2.1 pH值优化
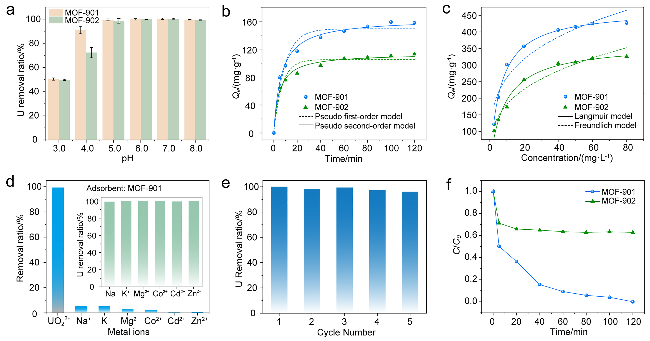
图2 (a)不同pH值下Ti-MOFs的铀提取率; (b)吸附动力学(pH=6.0, 初始浓度为100 mg•L−1); (c)吸附等温线(pH=6.0); (d) MOF-901对不同离子的提取率(pH=6.0); (e) MOF-901的可重复使用性(初始浓度为20 mg•L−1); (f) Ti-MOFs在加标海水(浓度为10 mg•L−1)中的铀吸附比Figure 2 (a) Uranium extraction rate of Ti-MOFs at different pH; (b) Adsorption kinetics (pH=6.0, initial concentration of 100 mg•L−1); (c) Adsorption isotherm (pH=6.0); (d) Extraction rate of MOF-901 for different ions (pH=6.0); (e) Reusability of MOF-901 (initial concentration of 20 mg•L−1); (f) Uranium adsorption ratio of Ti-MOFs in spiked seawater (concentration of 10 mg•L−1) |
2.2.2 吸附动力学
2.2.3 吸附等温线
2.2.4 离子选择性
2.2.5 可重复使用性
2.2.6 真实水样中的铀酰提取率
2.3 Ti-MOFs对$UO_{2}^{2+}$的吸附机理探究

图3 (a) MOF-901吸附$\text{UO}_{2}^{2+}$前后的XPS谱图; (b) MOF-901和MOF-902的孔径分布图; (c) MOF-901的N1s高分辨XPS谱图; (d) Ti-MOFs的孔径对铀吸附的影响示意图Figure 3 (a) XPS spectra of MOF-901 before and after adsorption of $\text{UO}_{2}^{2+}$; (b) Pore size distribution of MOF-901 and MOF-902; (c) High resolution XPS of N1s from MOF-901; (d) Schematic representation of the effect of pore aperture on uranium extraction for Ti-MOFs |