

1 引言
2 结果与讨论
2.1 单变量分析
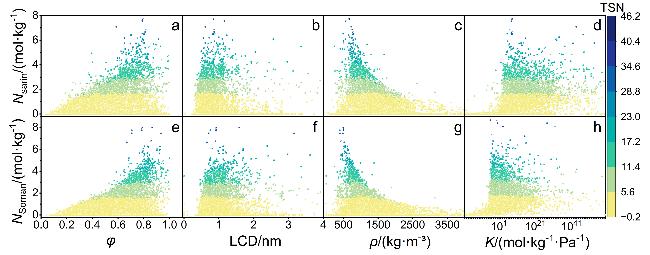
图1 梭曼和沙林吸附行为的结构-性能关系Figure 1 Structure-performance relationships for the adsorption of sarin and soman (a) Nsarin-φ; (b) Nsarin-LCD; (c) Nsarin-ρ; (d) Nsarin-K; (e) Nsoman-φ; (f) Nsoman-LCD; (g) Nsoman-ρ; (h) Nsoman-K. The color represents the value of TSN. Each figure contains the data of MOFs |
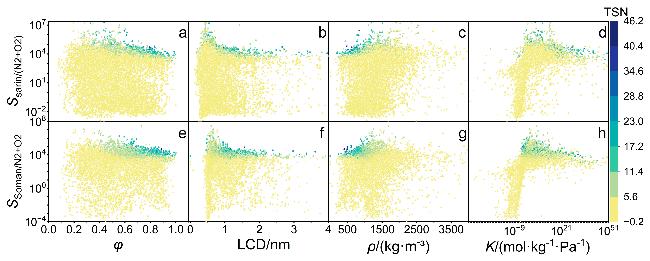
图2 梭曼和沙林气体选择性的结构-性能关系Figure 2 Structure-performance relationships for the selectivity of sarin and soman (a) Ssarin-φ; (b) Ssarin-LCD; (c) Ssarin-ρ; (d) Ssarin-K; (e) Ssoman-φ; (f) Ssoman-LCD; (g) Ssoman-ρ; (h) Ssoman-K. The color represents the value of TSN. Each figure contains the data of MOFs |
表1 MOFs吸附四种有毒物质时不同描述符的最佳范围Table 1 Optimal ranges of different descriptors for MOFs adsorbing four toxic agents |
| 气体 | 描述符 | 吸附量N/(mol•kg-1) | 选择性S |
|---|---|---|---|
| 梭曼、沙林 | φ | 0.71~0.78 | 0.22~0.90 |
| VSA/(m2•cm-3) | 2446~2647 | 328~1160 | |
| LCD/nm | 0.664~0.918 | 0.496~0.755 | |
| PLD/nm | 0.542~0.868 | 0.262~0.589 | |
| ρ/(kg•m-3) | 421~635 | 915~1953 | |
| K/(mol•kg-1•Pa-1) | 0.18×10⁻²~1.5×10⁷ | 1.73×10⁻³~1.13×10³ | |
| Q0st/(kJ•mol-1) | 19.37~86.02 | 24.52~68.22 | |
| DIFP | φ | 0.67~1.02 | 0.14~0.73 |
| VSA/(m2•cm-3) | 1065~3290 | 334.3~1099.7 | |
| LCD/nm | 0.665~1.336 | 0.504~1.164 | |
| PLD/nm | 0.493~1.362 | 0.219~1.164 | |
| ρ/(kg•m-3) | 392.7~690.9 | 1125.3~3260.5 | |
| K/(mol•kg-1•Pa-1) | 0.0001~5.33×10⁶ | 0.12~5.8×10¹¹ | |
| Q0st/(kJ•mol-1) | 24.19~85.41 | 45.20~105.73 | |
| DMMP | φ | 0.67~1.14 | 0.13~0.64 |
| VSA/(m2•cm-3) | 1065 ~3290 | 309.4~2383.7 | |
| LCD/nm | 0.664~0.930 | 0.433~0.787 | |
| PLD/nm | 0.493~1.092 | 0.242~0.659 | |
| ρ/(kg•m-3) | 392.72~808.97 | 728.76~3370.18 | |
| K/(mol•kg-1•Pa-1) | 0.62~9.41×10⁶ | 0.003~2.28×10⁹ | |
| Q0st/(kJ•mol-1) | 55.69~228.24 | 46.63~203.89 |
2.2 多变量分析
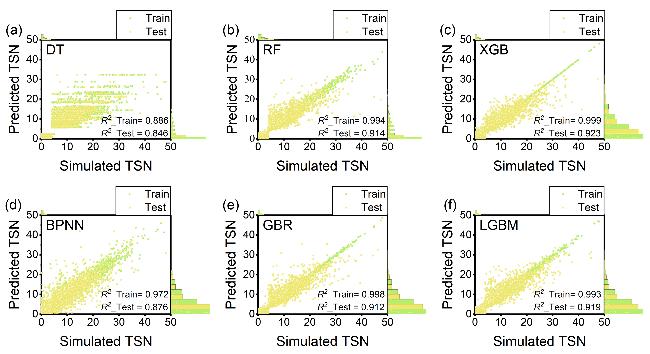
图3 六种机器学习算法TSN预测性能对比Figure 3 Comparison of the simulated TSN and the predicted TSN obtained from six ML algorithms (a) DT; (b) RF; (c) XGB; (d) GBR; (e) BPNN; (f) LGBM. The dots represent the number of MOFs |
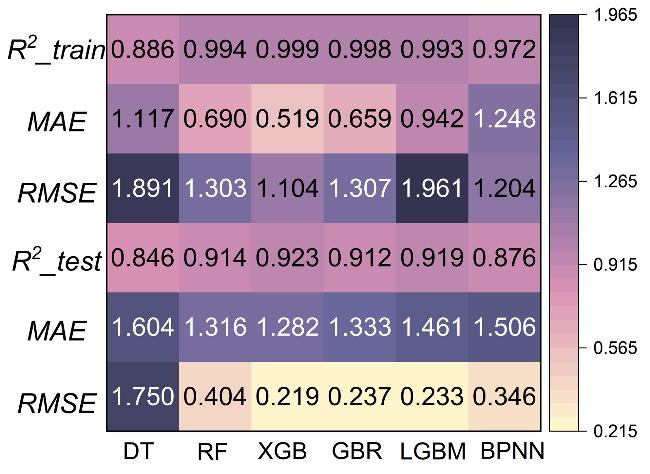
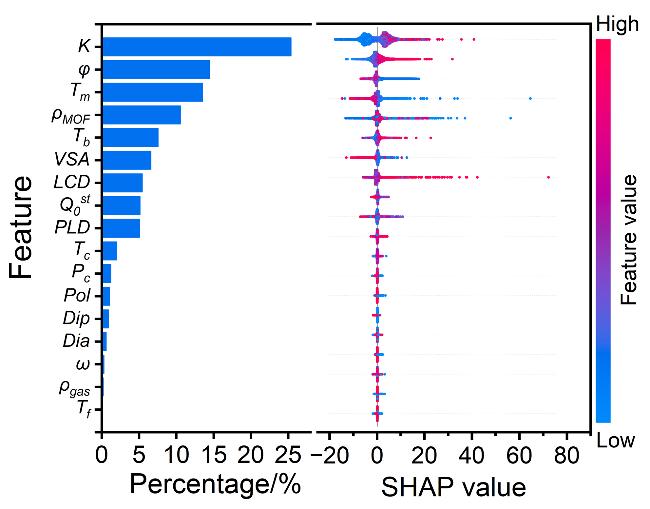
图5 全局特征重要性(左, 条形图)和局部解释摘要(右, 蜂群图), 其中点代表本研究中的单个数据点注意: x轴上的点显示每个数据点如何影响模型对每个特征的预测, 当多个点位于同一x位置时, 它们显示密度(颜色表示特征值, 其中红点表示高, 蓝点表示低; 正SHAP值表示对预测值的正特征影响, 负SHAP值表示对预测值的负特征影响) Figure 5 Global feature importance (left, bar charts) and local explanation summary (right, beeswarm plots), in which a dot represents an individual data point in this study Note: The dot on the x-axis shows how each data point impacts the model’s prediction for each feature, and when multiple dots are at the same x position, they show the density (Colors represent eigenvalues, where red dots represent high and blue dots represent low; positive SHAP values indicate a positive feature effect on the predicted value, and negative SHAP values indicate a negative feature effect on the predicted value) |
2.3 优异MOFs的共性
表2 吸附四种毒剂对MOF吸附性能影响较大的结构Table 2 Critical structural properties governing MOF adsorption of four toxic agents |
| 毒剂 | Linker | 相应 次数 | Topology | 次数 | ||
|---|---|---|---|---|---|---|
| sarin |  QMKYBPDZANOJGF C9H6O6 |  OYFRNYNHAZOYNF C8H6O6 |  LSHYAWDVBASRBW PO4 | 8/5/4 |  srs | 13 |
| DIFP |  GZJYHAYPVZNUJX C8H6O4 |  SATWKVZGMWCXOJ C27H18O6 |  QMKYBPDZANOJGF C9H6O6 | 8/5/4 |  sql | 14 |
| soman |  GZJYHAYPVZNUJX C8H6O4 |  QMKYBPDZANOJGF C9H6O6 |  KKEYFWRCBNTPAC C8H6O4 | 16/5/3 |  kgm | 12 |
| DMMP |  GZJYHAYPVZNUJX C8H6O4 |  QMKYBPDZANOJGF C9H6O6 |  KKEYFWRCBNTPAC C8H6O4 | 15/8/3 |  sql | 15 |