

1 引言
2 结果与讨论
2.1 TEAOH的引入对薄膜形貌的影响
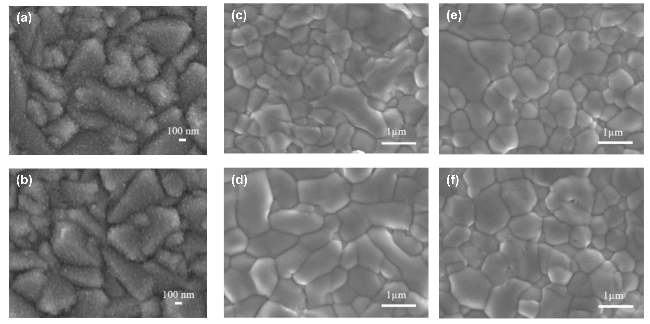
图2 (a)空白, (b) 4 mg•mL−1 TEAOH修饰的TiO2薄膜平面SEM图; (c)空白组, (d) 3 mg•mL−1, (e) 4 mg•mL−1, (f) 5 mg•mL−1 TEAOH修饰后的FAPbBr3钙钛矿薄膜的平面SEM图Figure 2 Plan-view SEM images of (a) unmodified TiO2 film; (b) TiO2 film modified with an optimal concentration of TEAOH; (c) pristine FAPbBr3 perovskite film; and (d~f) FAPbBr3 perovskite films modified with TEAOH at concentrations of 3, 4, and 5 mg•mL−1, respectively |
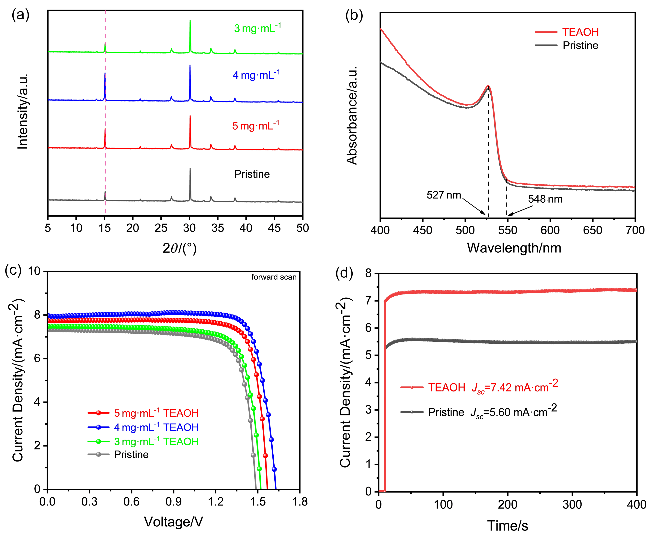
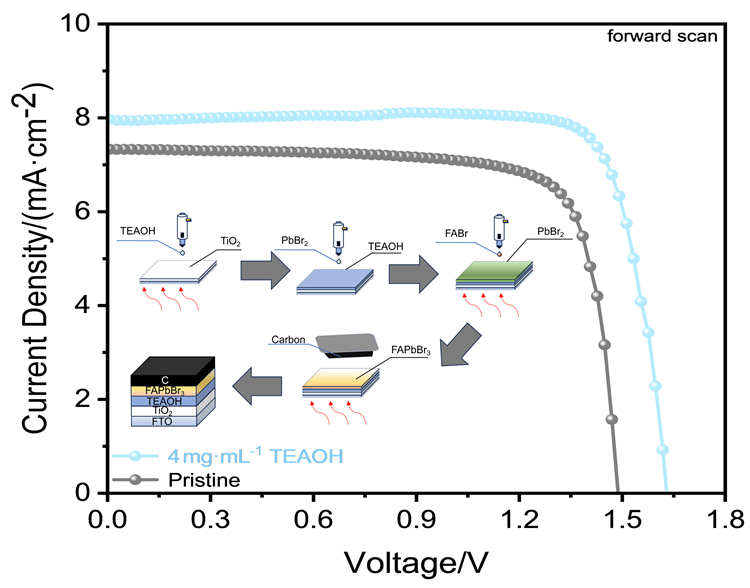
图3 (a)空白组和不同浓度TEAOH修饰的PSCs器件的XRD谱图; (b)空白组和TEAOH修饰的PSCs器件薄膜的UV-Vis吸收光谱; (c)空白组和不同质量浓度TEAOH溶液界面修饰FAPbBr3 PSCs的J-V曲线; (d)空白组和TEAOH修饰的PSCs器件的稳态输出曲线Figure 3 (a) XRD patterns of PSC devices without modification (pristine) and with different concentrations of TEAOH treatment; (b) UV-Vis absorption spectra of perovskite films of pristine and TEAOH-modified PSC devices; (c) J-V curves of FAPbBr3 PSCs with interfacial modification using TEAOH solutions of different concentrations and the pristine group; (d) steady-state output curves of PSCs from the pristine group and those modified with TEAOH |
2.2 TEAOH的引入对器件光电性能的影响分析
表1 不同质量浓度TEAOH界面修饰的FAPbBr3 PSCs的光伏参数Table 1 Photovoltaic parameters of FAPbBr3 PSCs with interfacial modification using TEAOH at different concentrations |
| Sample | VOC/V | JSC/(mA•cm−2) | FF/% | PCE/% |
|---|---|---|---|---|
| Pristine | 1.49 | 7.33 | 77.84 | 8.50 |
| TEAOH-5 | 1.57 | 7.73 | 81.98 | 9.95 |
| TEAOH-4 | 1.63 | 7.99 | 83.74 | 10.91 |
| TEAOH-3 | 1.52 | 7.49 | 78.12 | 8.89 |
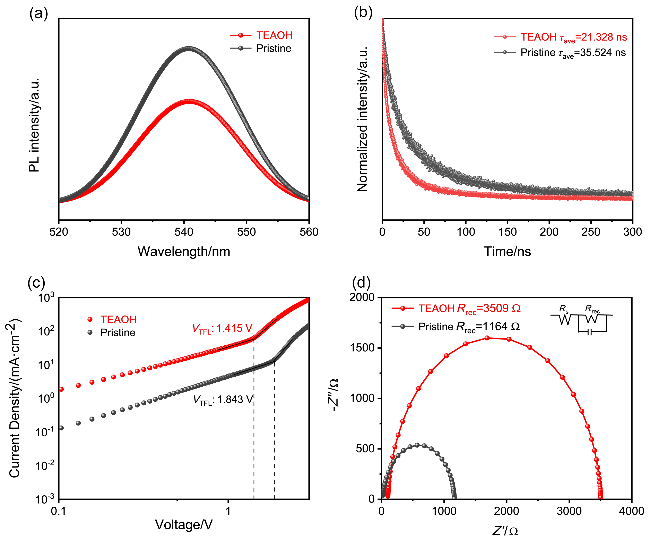
图4 空白组和4 mg•mL−1 TEAOH修饰的PSCs器件薄膜的(a) PL谱图, (b) TRPL谱图, (c) SCLC曲线图和(d)暗态EIS图Figure 4 The (a) PL spectrum, (b) TRPL spectrum, (c) SCLC curve and (d) dark-state EIS diagram of the pristine group and 4 mg•mL−1 TEAOH-modified PSC device films |
表2 空白组和TEAOH修饰的PSCs器件薄膜的TRPL曲线参数Table 2 TRPL fitting parameters of the PSCs films for the pristine group and the TEAOH-modified group |
| Sample | τave/ns | A1/% | τ1/ns | A2/% | τ2/ns |
|---|---|---|---|---|---|
| Pristine | 35.524 | 77.58 | 43.233 | 22.42 | 8.843 |
| TEAOH | 21.328 | 56.35 | 32.817 | 43.65 | 6.498 |
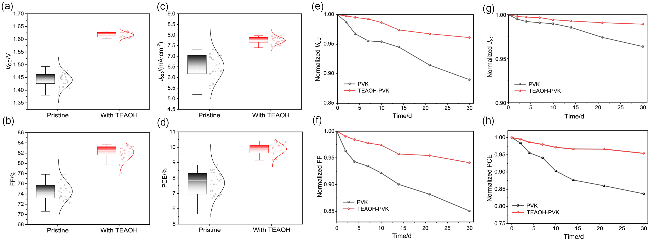
图6 30组空白组和TEAOH修饰的PSCs器件的(a) VOC箱线图, (b) FF箱线图, (c) JSC箱线图, (d) PCE箱线图; 空白组和TEAOH修饰的PSCs器件的30 d稳定性测试: (e) VOC稳定性, (f) FF稳定性, (g) JSC稳定性, (h) PCE稳定性Figure 6 The (a) VOC box plot, (b) FF box plot, (c) JSC box plot, (d) PCE box plot of the 30 sets of pristine group and TEAOH-modified PSC devices; The (e) VOC stability, (f) FF stability, (g) JSC stability, (h) PCE stability from the 30-day stability test of the pristine group and TEAOH-modified PSC devices |