


1 引言
2 结果与讨论
2.1 主客体分子的合成
2.2 客体分子G1的表征
2.2.1 荧光性能
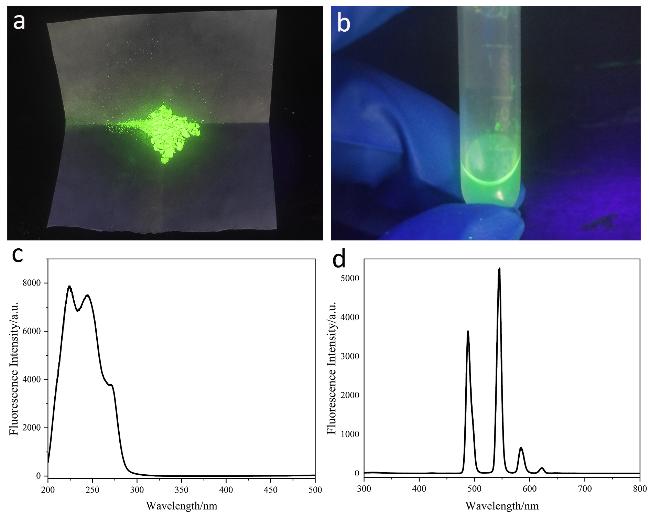
图2 (a) 254 nm紫外灯下的G1固体图像; (b) 254 nm紫外灯下的G1甲醇溶液图像; (c) G1甲醇溶液的荧光激发光谱; (d) G1甲醇溶液的荧光发射光谱Figure 2 (a) Image of G1 solid under 254 nm UV light; (b) Image of G1 methanol solution under 254 nm UV light; (c) Fluorescence excitation spectrum of G1 methanol solution; (d) Fluorescence emission spectrum of G1 methanol solution |
2.2.2 结构确定
表1 G1的元素分析数据Table 1 Elemental analysis data of G1 |
| 理论值 | 实测值 | ||||||
|---|---|---|---|---|---|---|---|
| C/% | N/% | H/% | C/% | N/% | H/% | ||
| 45.42 | 7.57 | 3.95 | 45.44 | 7.52 | 3.83 | ||
Note: % represents elemental mass percentage. |
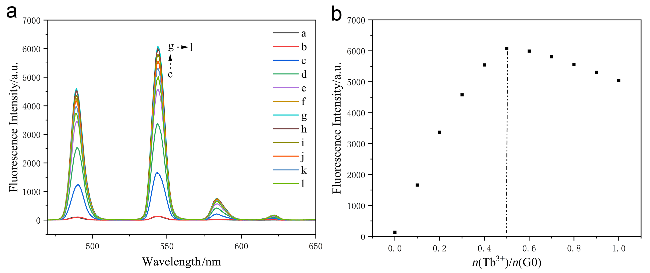
图3 Tb3+与G0配位过程的荧光滴定实验: (a) a、b分别为Tb3+、G0水溶液的荧光发射光谱, c~l依次对应的是G0水溶液中累计滴加0.1~1.0 equiv. Tb3+后的荧光发射光谱; (b)溶液荧光值随n(Tb3+)/n(G0)变化的工作曲线Figure 3 Fluorescence titration experiment of the coordination reaction between Tb3+ and G0: (a) a, b represent the fluorescence emission spectra of Tb³⁺ and G0 aqueous solutions, respectively, c~l correspond to the fluorescence emission spectra of G0 aqueous solution after cumulatively adding 0.1~1.0 equiv. Tb3+ in sequence; (b) Calibration curve of the solution fluorescence values as a function of n(Tb3+)/n(G0) |
2.3 超分子聚合物的生成
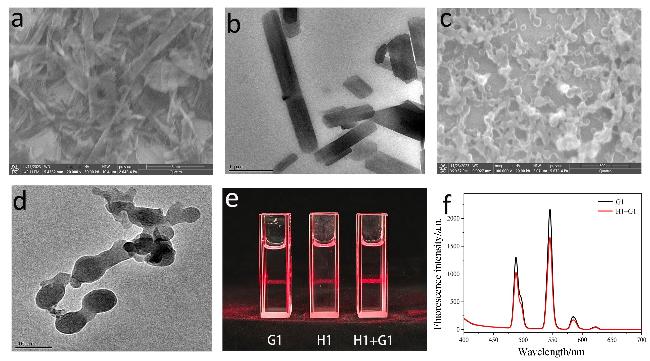
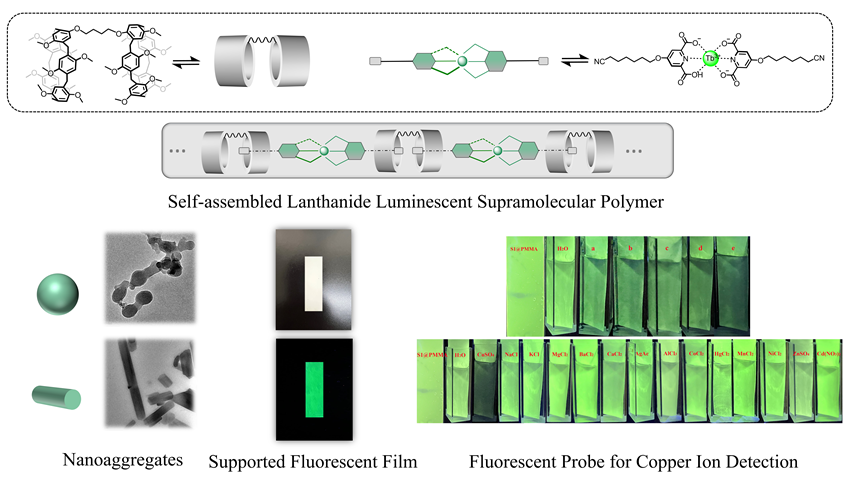
图4 超分子聚合物在1×10⁻³ mol/L浓度下的扫描电镜图(a)和透射电镜图(b); 超分子聚合物在1×10⁻⁵ mol/L浓度下的扫描电镜图(c)和透射电镜图(d); 1×10⁻⁵ mol/L浓度下H1与G1等物质的量混合液的丁达尔效应图(e); 1×10⁻⁵ mol/L浓度下超分子聚合物在DMF溶液中生成前后的荧光发射光谱(λex=272 nm) (f)Figure 4 SEM image (a) and TEM image (b) of the supramolecular polymer at a concentration of 1×10⁻³ mol/L; SEM image (c) and TEM image (d) of the supramolecular polymer at a concentration of 1×10⁻⁵ mol/L; Tyndall effect image (e) of equimolar mixtures of H1 and G1 at a concentration of 1×10⁻⁵ mol/L; Fluorescence emission spectra (f) of supramolecular polymer before and after formation in DMF solution at a concentration of 1×10⁻⁵ mol/L (λex=272 nm) |
2.4 铜离子荧光探针的开发
2.4.1 超分子聚合物对铜离子的识别与检测
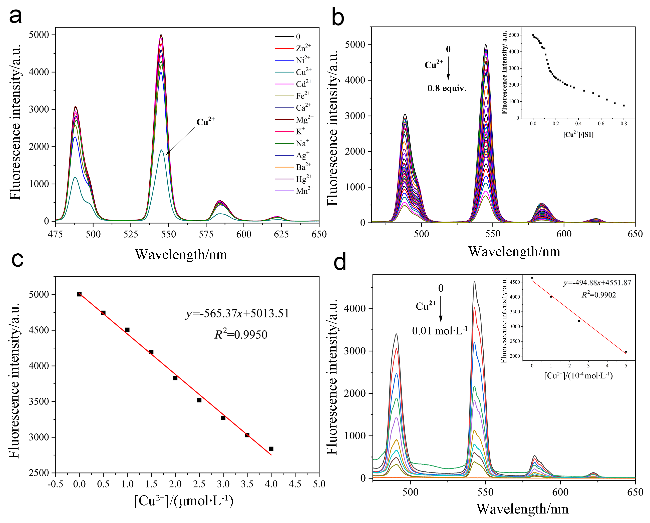
图6 (a)一系列S1溶液中加入不同金属离子(0.5 equiv.)水溶液后的荧光发射光谱; (b) S1溶液中累计滴加Cu2+ (0~0.8 equiv.)水溶液后的荧光发射光谱. 插图: 溶液荧光值随Cu2+与S1浓度比变化的工作曲线; (c) S1溶液荧光值与Cu2+浓度在一定范围内的线性相关曲线; (d)薄膜在0~0.01 mol/L Cu2+水溶液中的荧光发射光谱. 插图: 薄膜荧光值与Cu2+浓度在一定范围内的线性相关曲线Figure 6 (a) Fluorescence emission spectra of a series of S1 solution after adding different metal ions (0.5 equiv.) in aqueous. (b) Fluorescence emission spectra of S1 solution after cumulative addition of Cu2+ (0~0.8 equiv.) in aqueous. Insert: Curve of solution fluorescence values as a function of the Cu²⁺ to S1 concentration ratio. (c) Linear correlation curve between S1 solution fluorescence values and Cu²⁺ concentration within a specific range. (d) Fluorescence emission spectrum of the film in 0~0.01 mol/L Cu²⁺ aqueous solution. Insert: Linear correlation curve between film fluorescence values and Cu²⁺ concentration within a specific range |
2.4.2 荧光检测薄膜的制备及应用
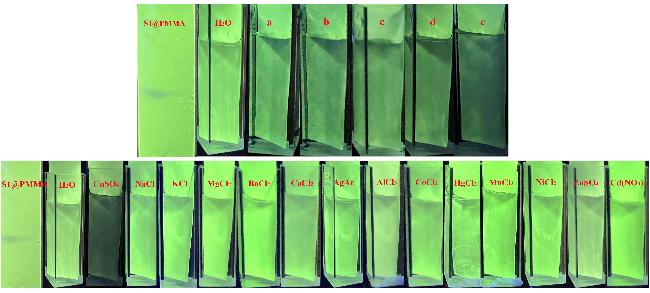


图7 254 nm紫外灯下的荧光检测薄膜(S1@PMMA 5.0%)图像. 上图为薄膜在不同浓度铜离子水溶液(a~e: Cu2+浓度由1×10⁻⁵递增为1×10⁻⁴ mol/L)中的图像; 下图为薄膜在不同金属离子水溶液中的图像(金属离子浓度均为1.67×10⁻⁴ mol/L)Figure 7 Images of detection film (S1@PMMA 5.0%) under 254 nm ultraviolet irradiation. Top image: film in a gradient concentration of copper ion aqueous solution (a~e represent Cu2+ concentration increasing from 1×10⁻⁵ to 1×10⁻⁴ mol/L); Bottom image: film in a series of metal ion salt solutions (concentration of all metal ions is 1.67×10⁻⁴ mol/L) |