


1 引言
2 结果与讨论
2.1 物理表征分析
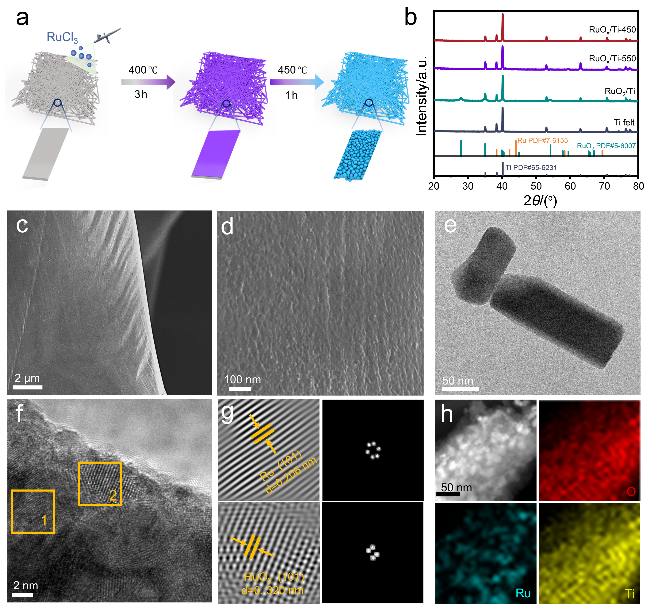
图1 (a) RuOx/Ti的合成示意图. (b)不同样品的XRD图谱. (c, d)不同分辨率下RuOx/Ti-450的SEM图像. (e, f) RuOx/Ti-450的TEM和HRTEM图像, (g)为(f)方框区域的逆傅里叶变换图. (h) RuOx/Ti-450的TEM-EDS元素映射图像Figure 1 (a) Schematic diagram of RuOx/Ti synthesis. (b) XRD patterns of all samples. (c, d) SEM images of RuOx/Ti-450 at different magnifications. (e, f) TEM image and HRTEM image of RuOx/Ti-450, (g) Inverse fast Fourier transform (IFFT) image corresponding to the framed region in (f). (h) TEM-EDS elemental mapping images of RuOx/Ti-450 |
2.2 OER电化学性能评估
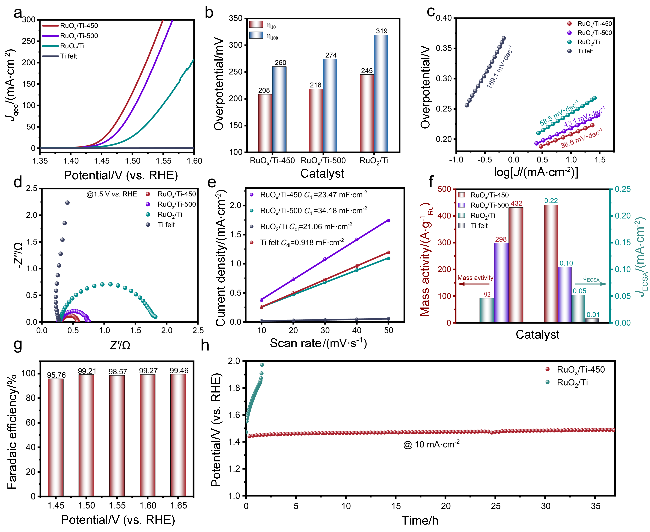
图3 不同催化剂(a)在0.5 mol•L-1 H2SO4中的LSV曲线, (b)在10、100 mA•cm-2下的过电位, (c) Tafel曲线, (d)在1.5 V vs. RHE时的EIS图谱, (e)电化学双层电容值, (f)在1.53 V vs. RHE时的质量活性(左)和经过电化学活性面积均一化后的电流密度值(右). (g) RuOx/Ti-450在不同电位下氧气的法拉第效率. (h)在计时电位法测试过程中不同催化剂的稳定性Figure 3 (a) LSV curves of all catalysts in 0.5 mol•L-1 H2SO4 electrolyte, (b) Overpotential at current densities of 10 and 100 mA•cm-2, (c) Tafel plots, (d) EIS Nyquist plots at 1.5 V vs. RHE, (e) ECSA values and (f) mass activity (left) and JECSA (right) at 1.53 V vs. RHE. (g) Oxygen Faradaic efficiency of RuOx/Ti-450 at different potentials. (h) Stability of different catalysts during chronopotentiometry tests |
2.3 HER电化学性能评估
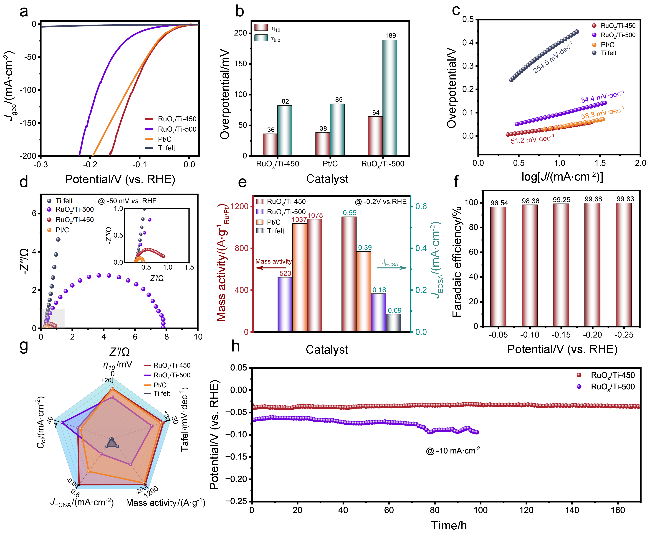
图4 不同催化剂(a)在0.5 mol•L-1 H2SO4中的LSV曲线, (b)在10、100 mA•cm-2下的过电位值, (c) Tafel曲线, (d) EIS图谱, 插图为图中灰色区域的放大图. (e)不同催化剂在-0.2 V vs. RHE时的质量活性(左)和经过电化学活性面积均一化后的电流密度值(右). (f) RuOx/Ti-450在不同电位下的氢气法拉第效率. (g)不同催化剂的性能对比图. (h) RuOx/Ti-450和RuOx/Ti-500在0.5 mol•L-1 H2SO4电解液中-10 mA•cm-2下的稳定性Figure 4 (a) LSV curves of all catalysts in 0.5 mol•L-1 H2SO4 electrolyte, (b) Overpotential at current densities of 10 and 100 mA•cm-2, (c) Tafel plots, (d) EIS spectrum. The inset shows a magnified view of the gray region, (e) mass activity (left) and JECSA (right) at -0.2 V vs. RHE. (f) Hydrogen Faradaic efficiency of RuOx/Ti-450 at different potentials. (g) Performance comparison diagram of all catalysts. (h) Stability of RuOx/Ti-450 and RuOx/Ti-500 at -10 mA•cm-2 in 0.5 mol•L-1 H2SO4 |
2.4 稳定性测试后的催化剂表征
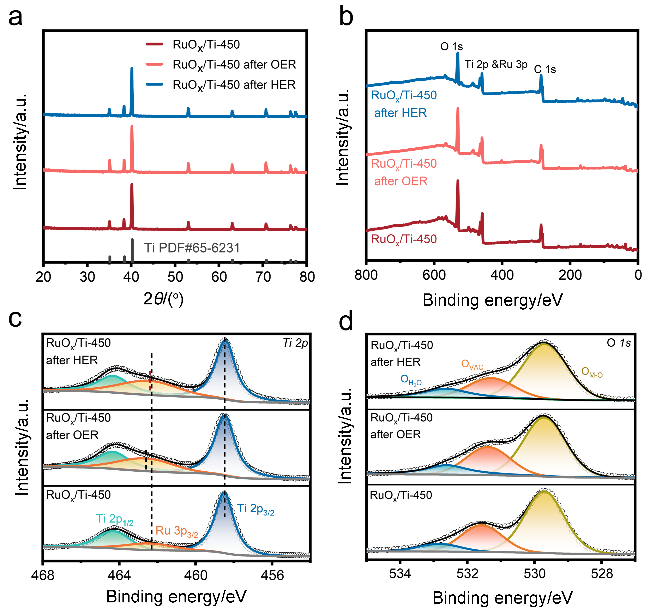


图5 RuOx/Ti-450在OER和HER稳定性测试前后的表征. (a) XRD图谱. (b) XPS总谱. (c) Ti 2p和Ru 3p3/2的高分辨图谱. (d) O 1s的高分辨图谱Figure 5 Characterization of RuOx/Ti-450 before and after OER and HER stability tests. (a) XRD spectrum. (b) XPS spectrum. (c) High-resolution spectrum of Ti 2p and Ru 3p3/2. (d) High-resolution spectrum of O 1s |