


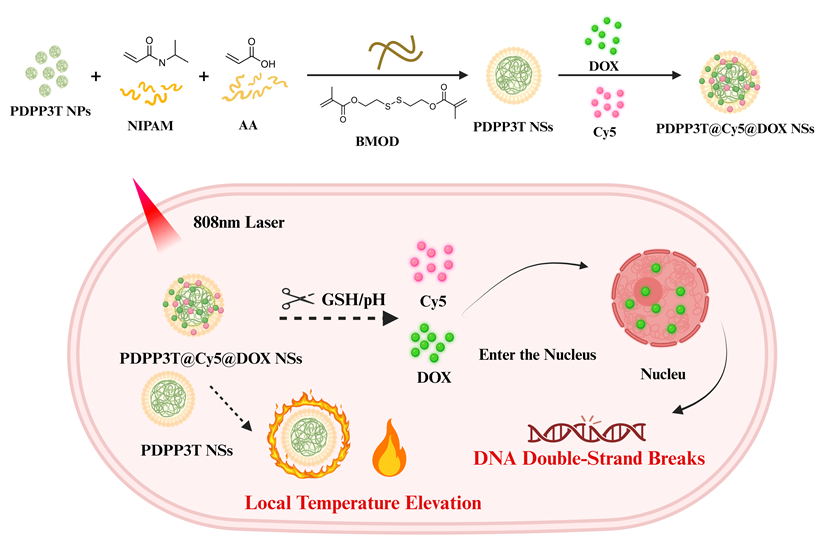
1 引言
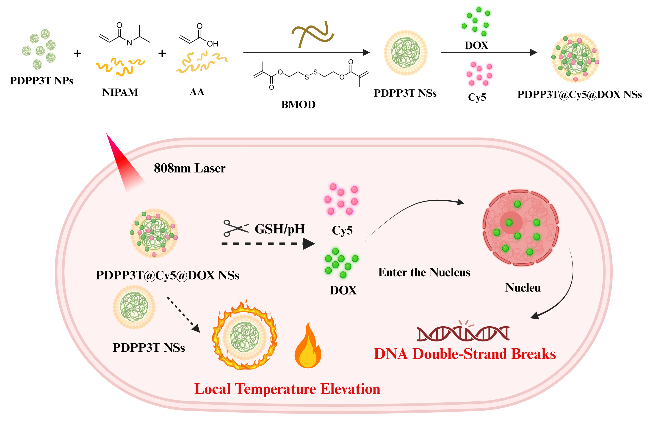
2 结果与讨论
2.1 PDPP3T@Cy5@DOX NSs的制备与表征
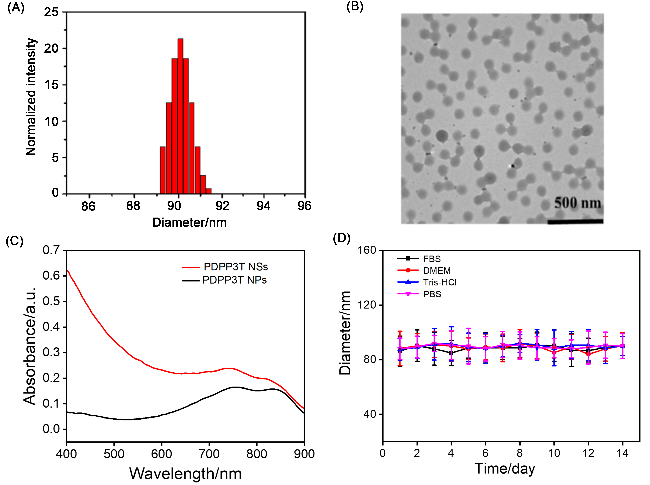
图2 (A) PDPP3T NSs的粒径分布图; (B) PDPP3T NSs的透射电子显微镜(TEM)图像; (C) PDPP3T NPs和PDPP3T NSs的紫外吸收光谱; (D) PDPP3T NSs在不同溶液中尺寸随时间变化情况Figure 2 (A) DLS data of PDPP3T NSs. (B) Transmission electron microscopy (TEM) image of PDPP3T NSs. (C) UV-Vis absorption spectra of PDPP3T NPs and PDPP3T NSs. (D) The hydrodynamic diameter of PDPP3T NSs as a function of storage time |
2.2 PDPP3T NSs的光热性能评估
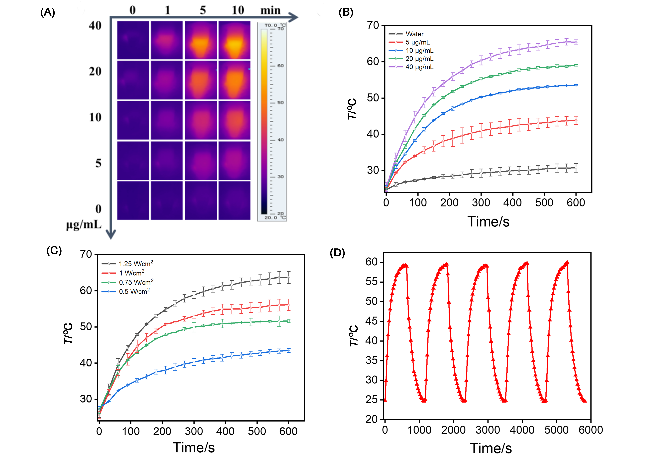
图3 (A) PDPP3T NSs的光热升温图像; (B)不同浓度和(C)不同激光功率照射下PDPP3T NSs的光热升温曲线; (D) PDPP3T NSs的光热循环稳定性. 数据以均值±标准差表示(n=3)Figure 3 (A) IR thermal images of PDPP3T NSs and water with 808 nm laser irradiation. Temperature elevation of PDPP3T NSs (B) at various concentrations under 808 nm irradiation at 1 W/cm2 and (C) with different laser power densities at 40 μg/mL. (D) Photothermal stability of PDPP3T NSs with 808 nm laser irradiation at 20 μg/mL. Data are presented as means±SD (n=3) |
2.3 pH/GSH双响应药物释放行为研究
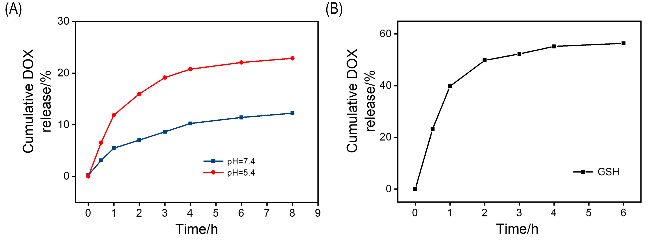
2.4 GSH响应下PDPP3T@Cy5@DOX NSs对DOX释放过程的监测
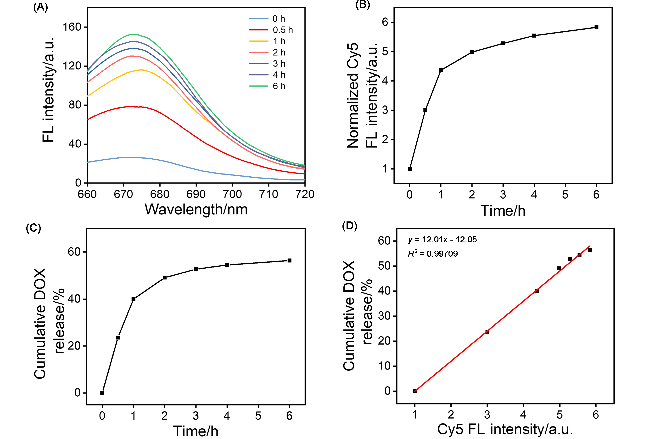
图5 (A) GSH处理不同时间下PDPP3T@Cy5@DOX NSs的荧光发射光谱. (B) GSH处理后不同时间点PDPP3T@Cy5@DOX NSs在675 nm处的荧光发射峰强度变化. (C) GSH处理后不同时间点PDPP3T@Cy5@DOX NSs中DOX的累积释放曲线. (D)在GSH存在条件下, DOX释放百分比与Cy5荧光强度增加倍数之间的线性关系拟合Figure 5 (A) Fluorescence emission spectrum of PDPP3T@Cy5@DOX NSs in PBS after the addition of GSH. (B) Intensity of the 675 nm emission peak of PDPP3T@Cy5@DOX NSs in the presence of GSH at different times. (C) Time-dependent profile of cumulative release of DOX from PDPP3T@Cy5@DOX NSs in the presence of GSH measured by UV-vis spectrophotometer. (D) Linear curve fitting between the percentage of released DOX and the increased fluorescence intensity of Cy5 in the presence of GSH |
2.5 pH响应下PDPP3T@Cy5@DOX NSs对DOX释放过程的监测
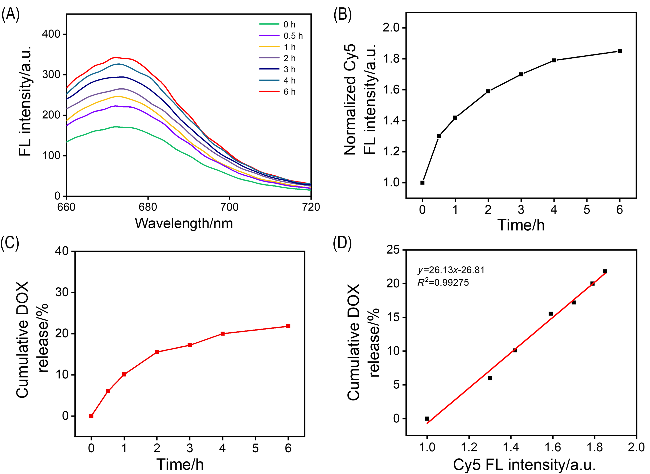
图6 (A) PDPP3T@Cy5@DOX NSs在pH 5.4缓冲液中的荧光发射光谱. (B)不同时间点PDPP3T@Cy5@DOX NSs溶液在675 nm处的荧光发射峰强度变化(pH 5.4). (C) PDPP3T@Cy5@DOX NSs中DOX的累积释放曲线(pH 5.4). (D) DOX释放百分比与Cy5荧光强度增加倍数之间的线性关系拟合(pH 5.4)Figure 6 (A) Fluorescence emission spectrum of PDPP3T@Cy5@DOX NSs in PBS buffer (pH 5.4). (B) Intensity of the 675 nm emission peak of PDPP3T@Cy5@DOX NSs in PBS buffer (pH 5.4) at different times. (C) Time-dependent profile of cumulative release of DOX from PDPP3T@Cy5@DOX NSs in PBS buffer (pH 5.4). (D) Linear curve fitting between the percentage of released DOX and the increased fluorescence intensity of Cy5 in PBS buffer (pH 5.4) |
2.6 pH/GSH双响应下PDPP3T@Cy5@DOX NSs对DOX释放过程的监测
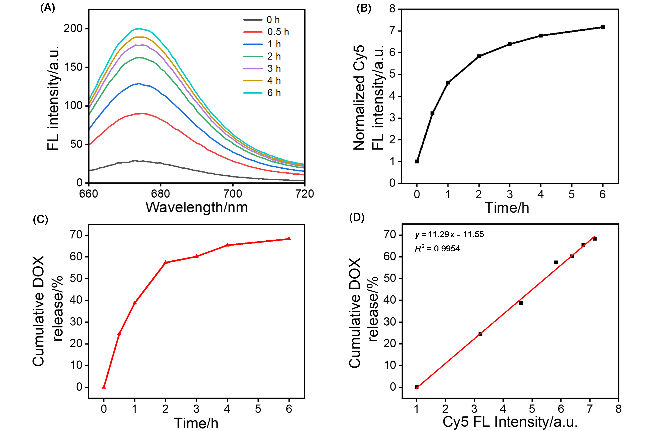
图7 (A) GSH处理后, PDPP3T@Cy5@DOX NSs PBS溶液(pH 5.4)的荧光发射光谱. (B) GSH处理后不同时间点PDPP3T@Cy5@DOX NSs在675 nm处的荧光发射峰强度变化(pH 5.4). (C) GSH处理后不同时间点PDPP3T@Cy5@DOX NSs中DOX的累积释放曲线(pH 5.4). (D)在GSH存在条件下, DOX释放百分比与Cy5荧光强度增加倍数之间的线性关系拟合Figure 7 (A) Fluorescence emission spectrum of PDPP3T@Cy5@DOX NSs in PBS after the addition of GSH (pH 5.4). (B) Intensity of the 675 nm emission peak of PDPP3T@Cy5@DOX NSs in the presence of GSH at different times (pH 5.4). (C) Time-dependent profile of cumulative release of DOX from PDPP3T@Cy5@DOX NSs in the presence of GSH measured by UV-vis spectrophotometer (pH 5.4). (D) Linear curve fitting between the percentage of released DOX and the increased fluorescence intensity of Cy5 in the presence of GSH |
2.7 PDPP3T@Cy5@DOX NS化学-光热联合治疗效果评估
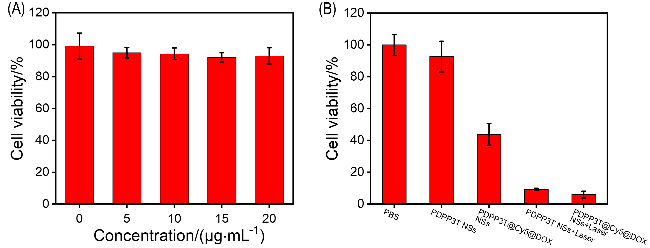
2.8 PDPP3T@Cy5@DOX NSs对细胞内DOX释放过程的监测
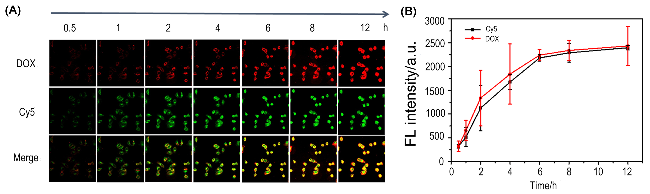


图9 (A) 4T1细胞与PDPP3T@Cy5@DOX NSs孵育不同时间的共聚焦荧光图像; (B) 4T1细胞与PDPP3T@Cy5@DOX NSs孵育不同时间的荧光强度曲线图Figure 9 (A) Fluorescence images of 4T1 cells incubated with PDPP3T@Cy5@DOX NSs for different times at 37 ℃. (B) Quantitative data of the fluorescence signal in 4T1 cells incubated with PDPP3T@Cy5@DOX NSs |