


1 半胱氨酸荧光探针的构建策略
表1 半胱氨酸荧光探针的构建策略与生物应用Table 1 Construction strategies and biological applications of cysteine fluorescent probes |
| Serial number | Construction strategies | Biological applications | Reference |
|---|---|---|---|
| 1 | With acrylate as the responsive site and naphthalimide as the fluorophore | Targeting the endoplasmic reticulum and recognizing cysteine | [7,8] |
| 2 | With coumarin derivatives as the responsive sites | Detecting cysteine in vivo | [9,10] |
| 3 | The chlorine atom on the probe is substituted by a thiol group, followed by an intramolecular rearrangement, resulting in fluorescence emission | Enabling cysteine imaging in HepG-2 cells and zebrafish | [11] |
| 4 | With thiobenzoate as the responsive site and aminoquinoline dye as the fluorophore | Detecting cysteine production during stress responses | [12] |
| 5 | With the disulfide ester moiety as the response site and quinoline derivative as the fluorophore | Detection of cysteine level fluctuations in living cells and zebrafish | [13] |
| 6 | Using 2,4-dinitrobenzenesulfonyl group as the response site to react with cysteine | Monitoring Hg2+-induced cysteine fluctuations in living cells | [14] |
| 7 | Using α,β-unsaturated acetylcarbazole as the fluorescent group, thiol as the response site, and methyl carbitol as the lysosome-targeting group | Detection of endogenous cysteine level changes under oxidative stress in living cells | [15] |
| 8 | With the red dye HDM as the fluorescent group and SBD-Cl as the response site | Tracking cysteine fluctuations under Cu2+/ H2O2-induced redox imbalance | [16] |
2 基于半胱氨酸荧光探针的组织病理学研究
2.1 阿尔兹海默症和帕金森
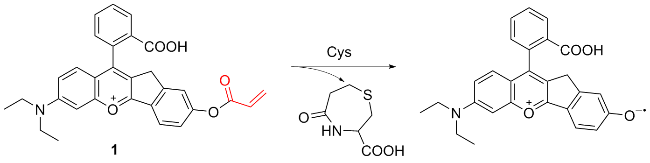
图式1 荧光探针1的结构及其作用机理Scheme 1 Structure of fluorescent probe 1 and its mechanism of action |
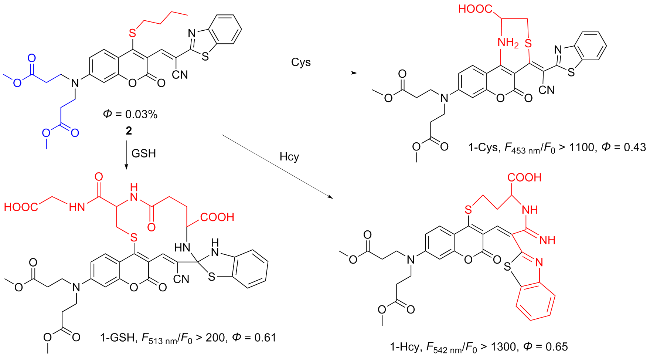
图式2 荧光探针2的结构及其作用机理Scheme 2 Structure of fluorescent probe 2 and its mechanism of action |
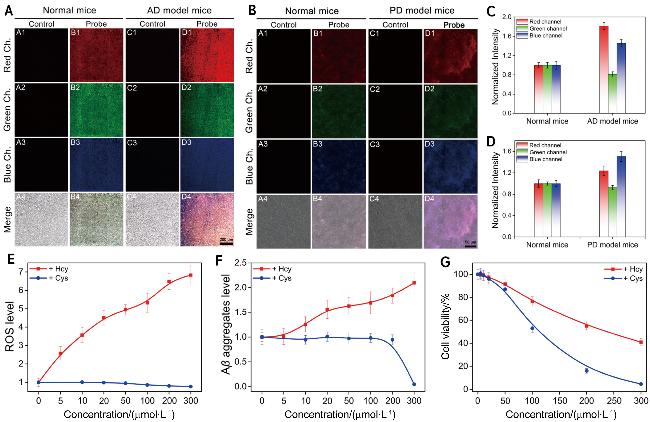
图1 (A)正常小鼠和转基因小鼠海马组织内源性Hcy、GSH和Cys的荧光成像; (B)正常小鼠和PD模型小鼠黑质组织内源性Hcy、GSH和Cys的共聚焦荧光成像; (C)图(A)中正常小鼠和转基因小鼠海马组织内源性Hcy、GSH和Cys对应的荧光强度; (D)图(B)中正常小鼠和PD模型小鼠黑质组织内源性Hcy、GSH和Cys对应的荧光强度; (E)不同浓度Hcy/Cys对细胞内活性氧的影响; (F)不同浓度Hcy/Cys对细胞Aβ聚集水平的影响; (G) MTT法测定不同浓度Hcy/Cys处理细胞1 h后的细胞活力[32]Figure 1 (A) Fluorescence imaging of endogenous Hcy, GSH, and Cys in hippocampal tissues of normal mice and transgenic mice; (B) Confocal fluorescence imaging of endogenous Hcy, GSH and Cys in substantia nigra tissues of normal mice and PD model mice; (C) Fluorescence intensities corresponding to endogenous Hcy, GSH, and Cys in the hippocampus of normal mice and transgenic mice in Figure (A); (D) Fluorescence intensities corresponding to endogenous Hcy, GSH, and Cys in substantia nigra tissues of normal mice and PD model mice in Figure (B); (E) Effect of different concentrations of Hcy/Cys on intracellular reactive oxygen species; (F) Effect of different concentrations of Hcy/Cys on the level of Aβ aggregation in cells; (G) MTT assay to determine cell viability of Hcy/Cys-treated cells at different concentrations after 12 h[32] |
2.2 抑郁症
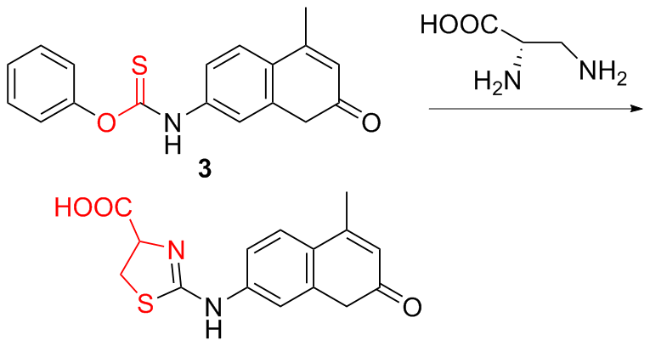
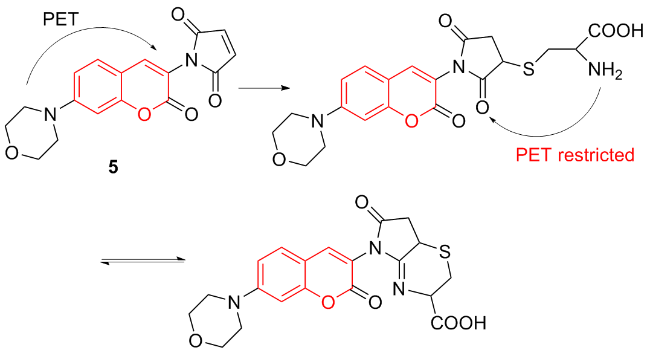
图式3 荧光探针3的结构及其作用机理Scheme 3 Structure of fluorescent probe 3 and its mechanism of action |
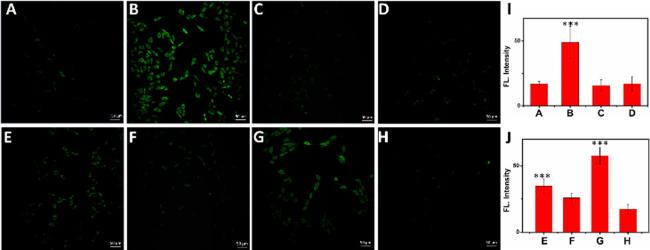
图2 PC12细胞的双光子荧光图像: (A)探针4处理组, (B) Cys组, (C) Hcy组, (D) GSH组, (E) Cys和H2O2组, (F) Cys和NEM组, (G) DTT组, (H) DTT和NEM组; (I)图(A)~(D)对应的荧光强度图; (J)图(E)~(H)对应的荧光强度图[43]Figure 2 Two-photon fluorescence image of PC12 cells: (A) probe 4 treatment group, (B) Cys group, (C) Hcy group, (D) GSH group, (E) Cys and H2O2 groups, (F) Cys and NEM groups, (G) DTT group, (H) DTT and NEM groups; (I) Fluorescence intensity plots corresponding to panels (A)~(D); (J) Fluorescence intensity plots corresponding to (E)~(H) panels[43] |
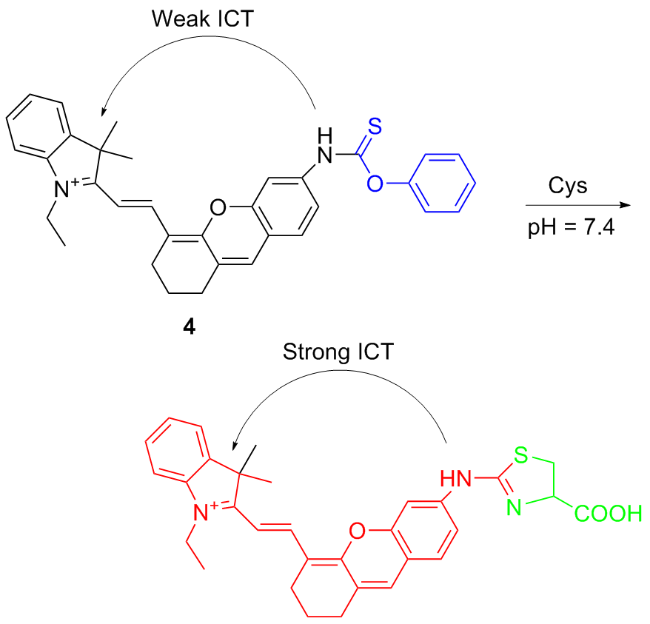
图式4 荧光探针4的结构及其作用机理Scheme 4 Structure of fluorescent probe 4 and its mechanism of action |
2.3 癫痫
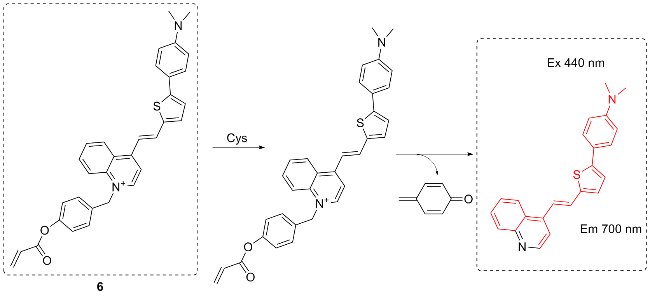
图式6 荧光探针6的结构及其作用机理Scheme 6 Structure of fluorescent probe 6 and its mechanism of action |
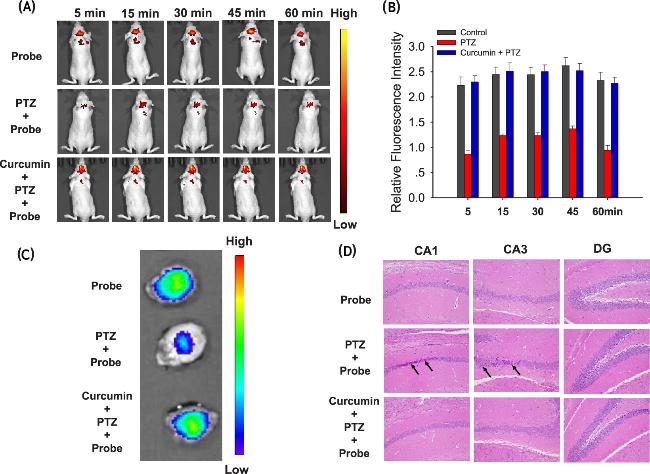
图3 (A)小鼠体内荧光成像(从上到下依次为健康小鼠、癫痫小鼠和姜黄素治疗的癫痫小鼠图像); (B)图(A)中健康小鼠、癫痫小鼠和姜黄素治疗的癫痫小鼠对应的荧光强度; (C)小鼠分离脑的荧光图像; (D)癫痫小鼠给药后海马区神经元损伤[50]Figure 3 (A) In vivo fluorescence imaging of mice (from top to bottom, images of healthy mice, epileptic mice, and curcumin-treated epileptic mice); (B) Fluorescence intensity of healthy mice, epilepsy mice, and epilepsy mice treated with curcumin in Figure (A); (C) Fluorescence image of mouse isolated brain; (D) Neuronal damage in the hippocampus after administration in epileptic mice[50] |
2.4 关节炎
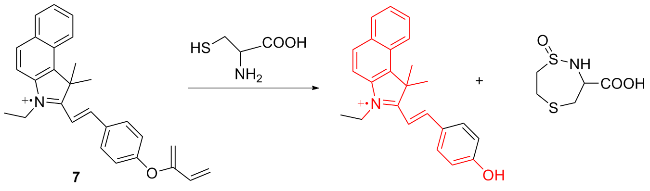
图式7 荧光探针7的结构及其作用机理Scheme 7 Structure of fluorescent probe 7 and its mechanism of action |
2.5 癌症
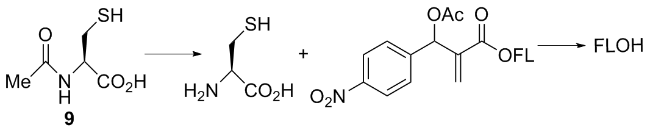
图式9 荧光探针9的结构及其作用机理Scheme 9 Structure of fluorescent probe 9 and its mechanism of action |
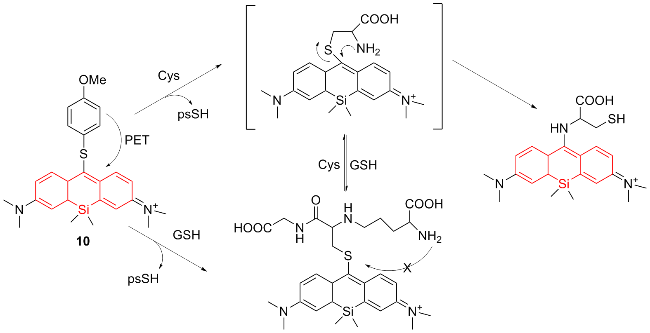
图式10 荧光探针10的结构及其作用机理Scheme 10 Structure of fluorescent probe 10 and its mechanism of action |
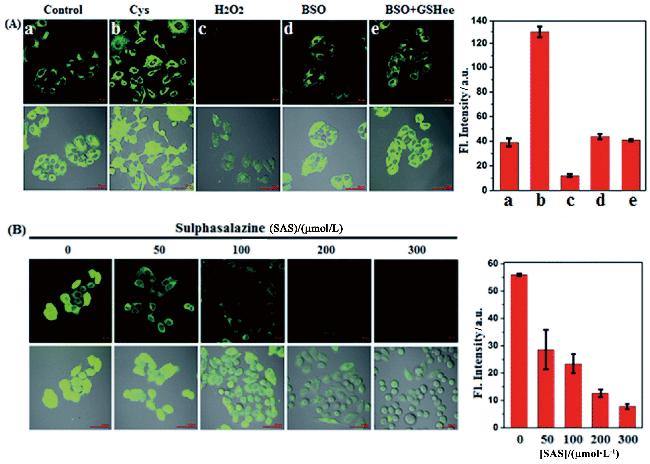
图5 (A)空白、Cys、H2O2、BSO、BSO+GSHee处理再用探针处理的Hela细胞荧光图像; (B)不同浓度的SAS预处理再用探针处理的Hela细胞荧光图像[65]Figure5 (A) Fluorescence images of Hela cells treated with blank, Cys, H2O2, BSO, BSO+GSHee and then treated with probes; (B) Fluorescence images of Hela cells pretreated with different concentrations of SAS followed by probes[65] |
2.6 肺纤维化
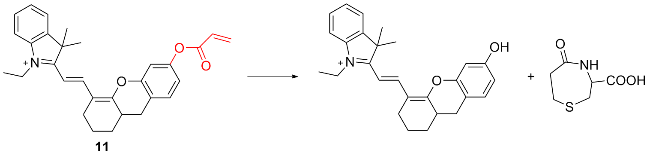
图式11 荧光探针11的结构及其作用机理Scheme 11 Structure of fluorescent probe 11 and its mechanism of action |
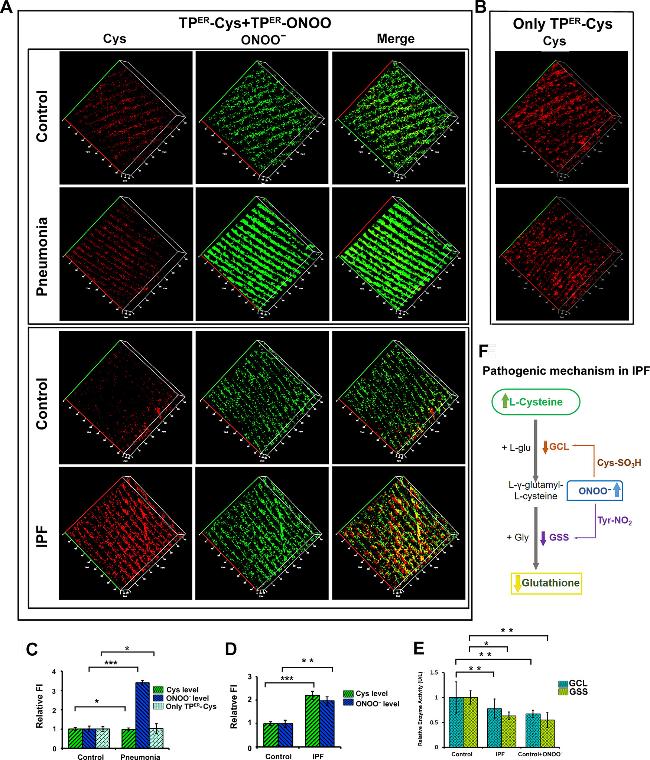
图6 (A)小鼠肺部TPER-Cys和TPER-ONOO的TP成像; (B)对照组和肺炎小鼠肺部TPER-Cys的荧光成像; (C)肺炎小鼠和对照小鼠肺组织的相对荧光强度; (D)肺纤维化和对照小鼠肺组织的相对荧光强度; (E)小鼠肺中GCL和GSS酶的相对活性; (F)肺纤维化中GSH合成的可能信号通路[70]Figure 6 (A) TP imaging of TPER-Cys and TPER-ONOO in mouse lungs; (B) Fluorescence imaging of TPER-Cys in the lungs of control and pneumonia mice; (C) Relative fluorescence intensity of lung tissue from pneumoniac mice and control mice; (D) Relative fluorescence intensity of lung fibrosis and control mouse lung tissue; (E) Relative activities of GCL and GSS enzymes in mouse lungs; (F) Possible signaling pathways for GSH synthesis in pulmonary fibrosis[70] |
2.7 肝损伤
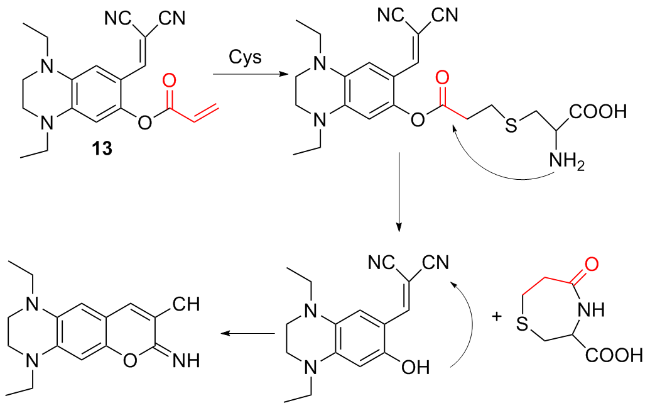
图式13 荧光探针13的结构及其作用机理Scheme 13 Structure of fluorescent probe 13 and its mechanism of action |
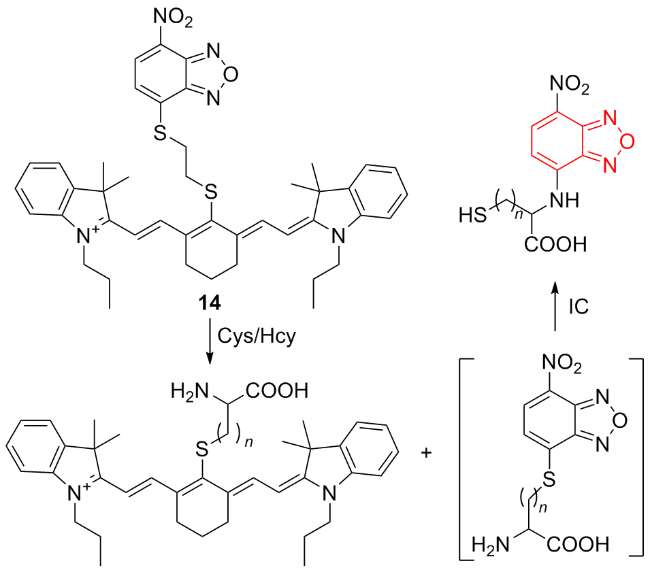
图式14 荧光探针14的结构及其作用机理Scheme 14 Structure of fluorescent probe 14 and its mechanism of action |
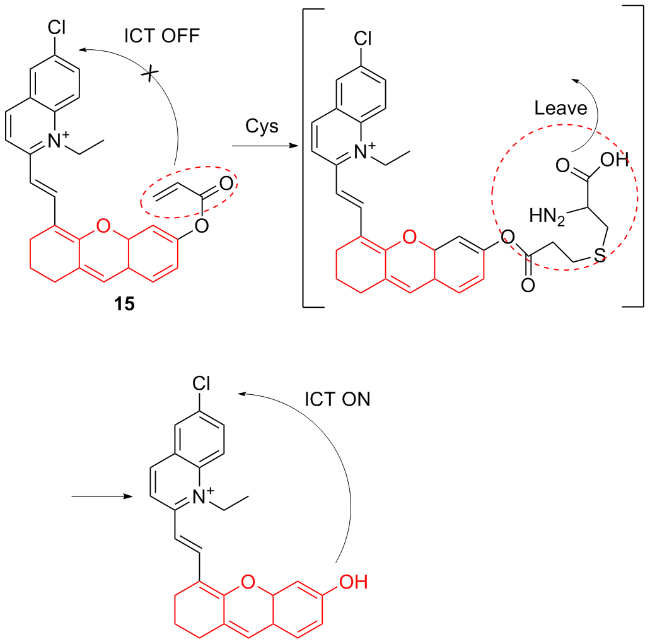
图式15 荧光探针15的结构及其作用机理Scheme 15 Structure of fluorescent probe 15 and its mechanism of action |
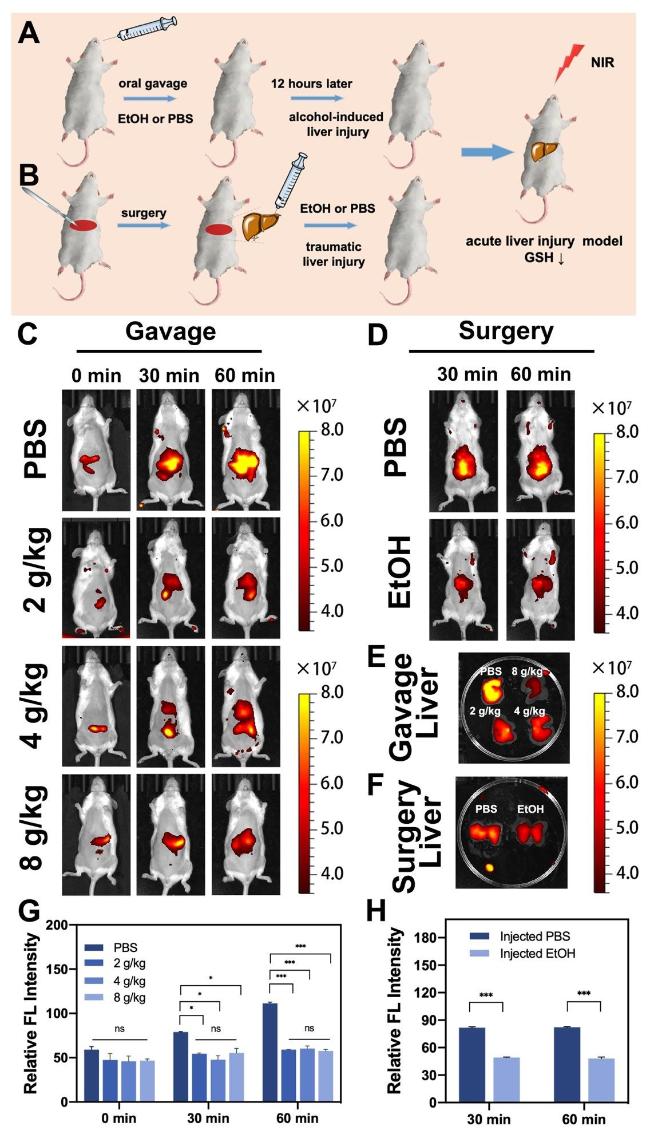
图7 (A)过量乙醇灌胃诱导ALI小鼠的示意图; (B)手术注射乙醇诱导ALI小鼠的示意图; (C)注射组ALI小鼠在0、30、60 min后的近红外荧光成像; (D)手术组ALI小鼠30、60 min后的近红外成像; (E)灌胃组离体肝脏荧光成像; (F)注射组离体肝脏的荧光成像; (G)灌胃组近红外荧光强度的半定量分析; (H)手术组近红外荧光强度的半定量分析[79]Figure 7 (A) Schematic diagram of ALI induced by over ethanol gavage; (B) Schematic diagram of ethanol-induced ALI mice surgically injected; (C) Near-infrared fluorescence imaging of ALI mice in the injection group after 0, 30, and 60 min; (D) Near-infrared imaging of ALI mice in the surgical group after 30 and 60 min; (E) Fluorescence imaging of isolated liver in the gastric perfusion group; (F) Fluorescence imaging of isolated liver in the injection group; (G) Semi-quantitative analysis of near-infrared fluorescence intensity in the gavage group; (H) Semi-quantitative analysis of near-infrared fluorescence intensity in the surgical group[79] |
2.8 糖尿病
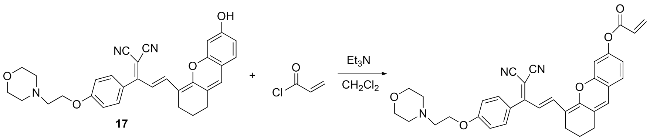
图式17 荧光探针17的结构及其作用机理Scheme 17 Structure of fluorescent probe 17 and its mechanism of action |
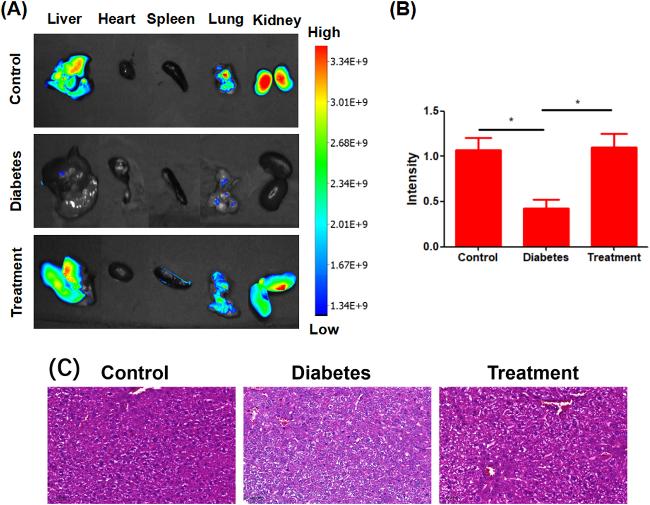
图8 (A)从上到下以此为对照组、糖尿病组、和治疗组小鼠在探针作用1 h后解剖器官的荧光图像; (B)图(A)中对照组、糖尿病组和治疗组对应的荧光强度; (C)图(A)中对照组、糖尿病组和治疗组肝脏切片的HE染色图片[87]Figure 8 (A) From top to bottom, this is the fluorescence image of the anatomical organs of the control group, the diabetic group, and the treatment group after 1 h of probe action; (B) Fluorescence intensity of the control group, diabetic group, and treatment group in Figure A; (C) HE staining images of liver sections of the control group, diabetic group, and treatment group in Figure A[87] |