

1 Introduction
Organic semiconducting materials have attracted intense interest in recent decades due to their chemical diversity, intrinsic flexibility and solution processability,[1] which endows them with a wide range of optoelectronic applications, such as organic light-emitting diodes,[2] organic field-effect transistors,[3] and organic solar cells (OSCs).[4] Among the various strategies to modulate the properties of these materials, rational design of donor (D) and acceptor (A) building blocks to construct D-A conjugated systems stands out as one of the most effective approaches. This strategy allows precise tuning of the critical characteristics such as optical properties, frontier molecular energy levels, and charge carrier mobilities.[5] For instance, electron- deficient building blocks like benzo[c][1,2,5]thiadiazole (BTz)[6] and naphtho[1,2-c:5,6-c']bis[1,2,5]thiadiazole (NTz)[7] are widely employed as acceptor units in organic semiconductors, contributing to the formation of linear D-A architectures. Recently, our group developed a novel V-shaped electron-deficient building block, 4,7-dibromo- triphenyleno[1,2-c:7,8-c']bis([1,2,5]thiadiazole) (TPTz), featuring a rigid extended conjugated plane with strong electron-withdrawing capability.[8] When incorporated into D-A copolymers, the TPTz unit conferred zigzag-type polymers with wide bandgaps, enhanced solubility, and a preferential “face-on” molecular orientation in thin films, facilitating the applications in OSCs. Furthermore, TPTz was utilized as acceptor unit to prepare D-A-D small molecular photosensitizers for multifunctional wound dressings.[9] Despite these advances, the full potential of TPTz unit remains underexplored and desirable.
On the other hand, D-A conjugated polymers typically suffer from limited solubility, broad molecular weight distribution, and batch-to-batch variation. In contrast, D-A conjugated oligomers offer well-defined structures and high chemical purity.[10] Indacenodithiophene (IDT) is a widely studied electron-rich component in D-A systems owing to its coplanarity, high electron density, and extended conjugation.[11] In this work, we present the design and synthesis of two zigzag-shaped D-A oligomers VG1 and VG2, incorporating IDT as the donor unit and TPTz as the electron-deficient acceptor unit. The structural, optical and electrochemical properties of these oligomers were comprehensively investigated through experimental and theoretical studies. The potential of these oligomers as donor materials in OSCs was evaluated, revealing insights into their structure-performance relationships.
2 Results and discussion
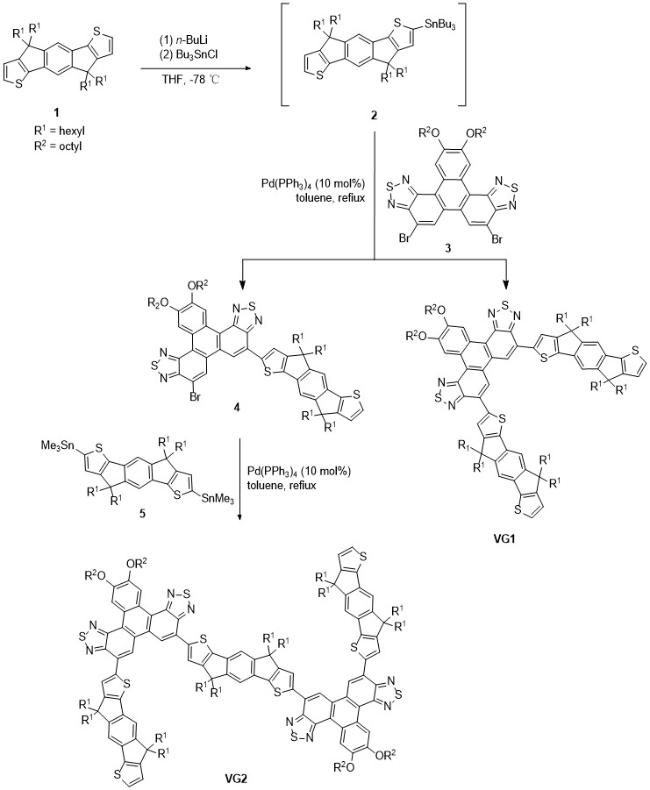
The synthetic route to the D-A oligomers VG1 and VG2 is shown in Scheme 1. Treatment of the commercially available 4,4,9,9-tetrahexyl-4,9-dihydro-s-indaceno[1,2-b: 5,6-b']dithiophene (1) with n-BuLi followed by tributyltin chloride afforded the tin intermediate 2 as light-yellow oil, which was directly used in the next step without further purification. Palladium-catalyzed Stille coupling reactions between 2 (2.5 equiv.) and dibromide 3 facilely provided the first-generation D-A oligomer VG1 in 35% yield as red solids. Reducing the loading of 2 to 1.0 equivalent resulted in the one-side coupled monobromide intermediate 4 with a yield of 29%. VG2 was prepared by twofold Stille coupling reactions between 4 and commercially available ditin 5 in 54% yield. All compounds showed good solubility in common organic solvents, and were purified by silica gel column chromatography. The structures were confirmed by 1H NMR, 13C NMR, and high-resolution matrix-assisted laser desorption ionization time-of-flight (MALDI-TOF) mass spectrometer.
Since single crystals suitable for X-ray diffraction analysis of these two oligomers were not obtained, their geometries were investigated relied on density functional theory (DFT) calculations at the B3LYP/6-31G(d,p) level, and the optimized structures are displayed in Figure 1. According to theoretical calculations, the two IDT units adopted a confirmation with the two hexyl chains pointing outwards at the linking sides, resulting in a small torsion angle (2.3°/ 2.4°) between the TPTz and IDT units, and the two linked IDT units deviated the π-conjugated plane of TPTz from planarity with a torsion angle of 10.7° (Figure 1a). Extension of the D-A structure demonstrated limited impact, and VG2 exhibits a slightly distorted structure (Figure 1b), which enhances the absolute fluorescence quantum yield (ΦFL-solid) in the solid state, thereby contributing to improved electroluminescence quantum efficiency (EQEEL). Due to the V-shaped structure of TPTz unit, the two oligomers adopt zigzag-type geometries, resulting in amorphous films as indicated in 1D-XRD patterns.
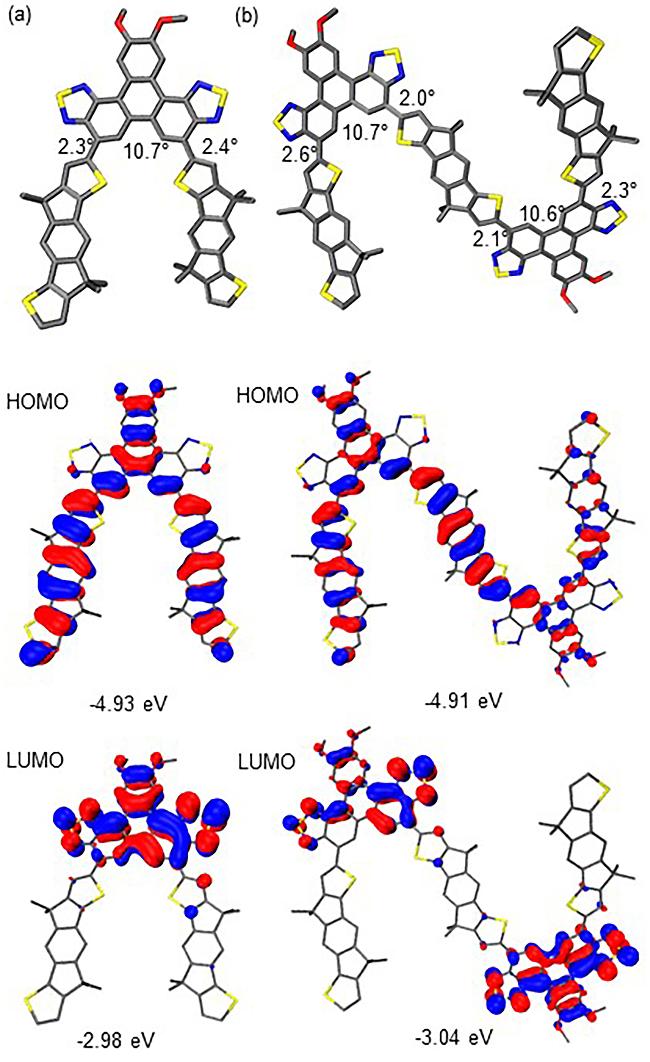
To shine light on the electronic structures, the highest occupied molecular orbital (HOMO) and lowest unoccupied molecular orbital (LUMO) were calculated based on the optimized geometries. As illustrated in Figures 1c and 1d, for both VG1 and VG2, the HOMO delocalized throughout the whole molecular skeletons, while the LUMO mainly localized on the electron-deficient TPTz segments. The separated HOMO and LUMO indicate their intramolecular charge-transfer characteristics. With extension of the π-conjugation, oligomer VG2 exhibits slightly deepened HOMO and LUMO energy levels, leading to comparable calculated energy gaps of 1.95 eV for VG1 and 1.87 eV for VG2. These theoretical results reveal that increasing the number of repeating units in these series of V-shaped D-A oligomers extend π-electron delocalization, but shows limited changes to the energy gaps.
The photophysical properties of these two D-A oligomers were studied in diluted dichloromethane solutions and in thin films, and the data are summarized in Table 1. In diluted solutions, two sets of absorption bands were recorded in the 320~420, and 430~650 nm regions for both VG1 and VG2 with the former band attributed to the π-π* transitions of the conjugated backbone, and the latter to the intramolecular charge transfered between the IDT and TPTz units. A red-shift of 20 nm and much higher absorption intensity were observed for VG2 as displayed in Figure 2a. In films, the intensity of the longest-wave- length absorption peaks of VG2 was enhanced, indicating the increasing aggregation in the solid state. From the onset wavelengths of the absorption spectra in thin films, the optical band gaps (Egopt) could be calculated to be 2.05 eV for VG1, and 2.01 eV for VG2, in good agreement with the calculated energy gaps.
Table 1 Optical and electrochemical data of VG1 and VG2 |
| Compd. | λsolutiona/ nm | λfilma/ nm | λemb/ nm | Egopt c/ eV | EHOMOd/ eV | ELUMOd/ eV | ΦFL-solidf/ % | ΦFL-solutiong/ % | τse/ns | kr h/ (108 s-1) | knr h/ (108 s-1) |
|---|---|---|---|---|---|---|---|---|---|---|---|
| VG1 | 380, 457, 535 | 387, 469 | 647 | 2.05 | -5.10 | -3.09 | 0.8 | 45.3 | 4.3 | 1.05 | 1.27 |
| VG2 | 383, 469, 515 | 389, 483, 572 | 650 | 2.01 | -5.07 | -3.09 | 1.8 | 41.3 | 3.4 | 1.21 | 1.72 |
. a The maximum absorption and emission wavelengths measured in CH2Cl2. b The maximum emission wavelength measured in CH2Cl2. c Optical band gaps calculated from the onset wavelength of the absorption spectra using the equation Egopt=1240/λonset. d Frontier molecular orbital energy levels from cyclic voltammetry were estimated as: EHOMOcv (eV)=-(Eonsetox-EFc/Fc++4.8) (eV), ELUMOcv (eV)=-(Eonsetred-EFc/Fc++4.8) (eV). e Fluorescence lifetime (τs). f Absolute quantum yield measured in the solid state. g Absolute quantum yield measured in CH2Cl2. h Radiative (kr) and nonradiative (knr) decay rate constants calculated by the equations kr=ΦFL-solution/τs and knr=(1-ΦFL-solution)/τs. |
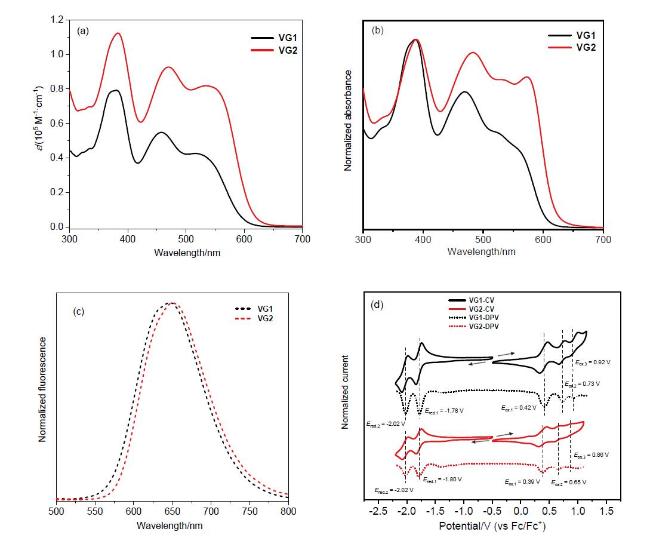
Both oligomers VG1 and VG2 exhibit bright red emission in the range of 550~750 nm in diluted solutions (Figure 2c), and the absolute fluorescence quantum yields (ΦFL-solution) in dichloromethane (DCM) were recorded to be 45.3% and 41.3% for VG1 and VG2, respectively. To assess the excited state kinetics, the fluorescence decay profiles were measured. The fluorescence lifetimes (τs) were determined to be 4.3 ns for VG1, and 3.4 ns for VG2 (Table 1). Derived from ΦFL-solution and τs, the radiative rate (kr) and non-radiative rate (knr) values can be estimated. The results are listed in Table 1. According to the calculations, the kr and knr for both oligomers are comparable, and the slightly higher knr of VG2 rationalized the reduced ΦFL-solution. In solution, excessively rigid conjugated planes may induce intramolecular charge transfer, leading to excited-state energy dissipation through molecular vibrational/rotational motions and consequently reducing quantum yield. Conversely, in the solid state, the restriction of conjugated plane vibrations/rotations within molecular stacks suppresses non-radiative decay pathways, thereby enhancing quantum yield. This transition from solution to solid state is accompanied by aggregation-caused quenching (ACQ), resulting in a pronounced modulation of quantum yield across different aggregation states.[12]
Electrochemical properties of these oligomers were examined using cyclic voltammetry (CV) and differential pulse voltammetry (DPV) measurements. As demonstrated in Figure 2d, VG1 and VG2 exhibited multiple reversible oxidation and reduction waves. With extension of the π-conjugation, the first oxidation and reduction potentials decreased. From the onset potentials of the first oxidation and reduction peaks, the HOMO and LUMO energy levels were estimated to be -5.07 and -3.09 eV for VG1, and -5.10 and -2.97 eV for VG2, which are consistent with the calculated values. The energy levels of VG1 and VG2 matches the energy levels of Y6.
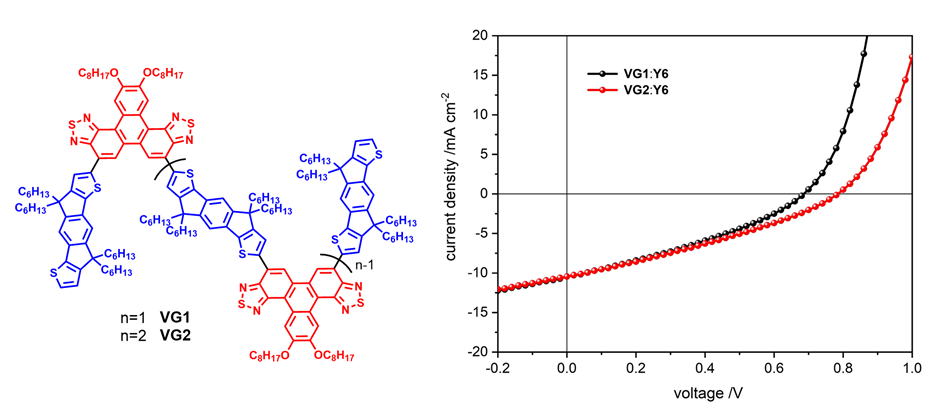
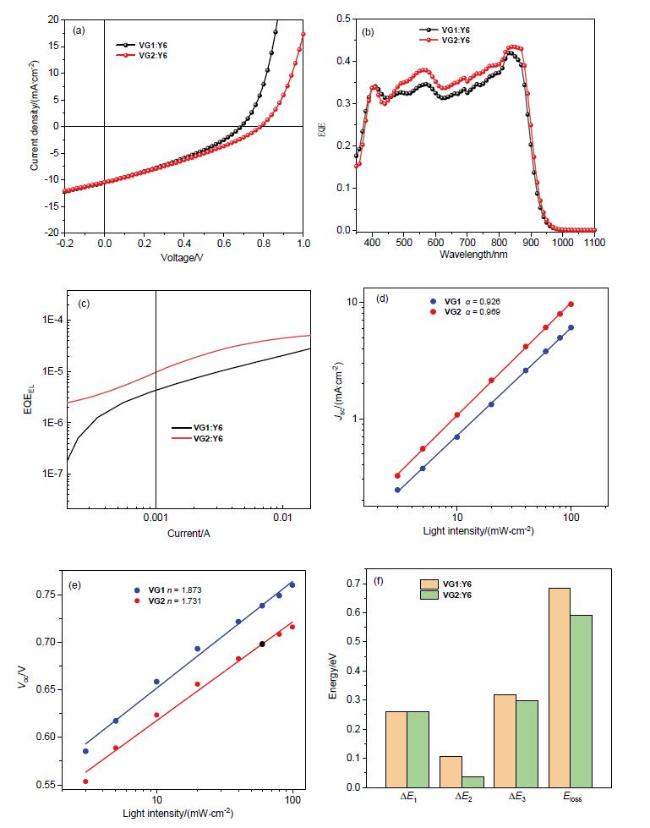
Considering the intensive absorption in the range of 300~600 nm and suitable energy levels, the application of these oligomers as donor materials for non-fullerene organic photovoltaics were tested with Y6 as the acceptor material. The photovoltaic performance was assessed by fabricating conventional solar cell devices with the structure of ITO/PEDOT:PSS/VG1(VG2):Y6 (1.0∶1.2 by weight)/PDINN/Ag. Upon the addition of 1,8-diiodooctane (DIO, 0.25%), the device performance was optimized. The optimized photovoltaic parameters were summarized in Table 2 and the photovoltaic parameters of the optimized devices were summarized in Table 2. The current density-voltage (J-V) curves for the optimized devices are presented in Figure 3a. The VG2:Y6 binary devices exhibited a better power conversion efficiency (PCE) of 2.56% with a short-circuit current (Jsc) of 10.44 mA•cm-2, an opencircuit voltage (Voc) of 0.78 V, and a fill factor of 31.33%. The VG1:Y6 binary devices showed a similar Jsc of 10.49 mA•cm-2, and a smaller Voc of 0.68 V, resulting in a PCE of 2.37%. Figure 3b shows the external quantum efficiency (EQE) spectra of the OSC devices, and broad photoresponse was achieved from 300 nm to 900 nm, reflecting the complementary light absorption of the two oligomers and Y6. The calculated current densities obtained by integrating the EQE were estimated to be 9.92 and 9.50 mA•cm-2, respectively, for the VG1 and VG2 based devices.
Table 2 Photovoltaic parameters of devices based on VG1 and VG2 |
| Device | Voc/V | Jsc/(mA•cm-2) | FF/% | PCE/% | Eg/eV | ΔE1/eV | ΔE2/eV | ΔE3/eV | Eloss/eV | EQEEL/% |
|---|---|---|---|---|---|---|---|---|---|---|
| VG1:Y6 | 0.68 | 10.49 | 32.95 | 2.37 | 1.382 | 0.261 | 0.105 | 0.318 | 0.684 | 4.36×10⁻⁴ |
| VG2:Y6 | 0.78 | 10.44 | 31.33 | 2.56 | 1.371 | 0.260 | 0.035 | 0.298 | 0.592 | 9.78×10⁻⁴ |
The charge-carrier mobilities were measured using the space-charge-limited current (SCLC) method. The hole mobilities in the blend films were determined to be 2.91× 10⁻⁴, and 3.50×10⁻⁴ cm2 V-1•s-1 for VG1 and VG2, respectively. The electron mobilities for VG1 and VG2 based devices were calculated to be 1.92×10⁻⁴ and 1.72× 10⁻⁴ cm2•V-1•s-1, respectively. The imbalanced hole/elec- tron mobilities in oligomers indicate inferior charge trans- port properties, which account for the diminished fill factor (FF) and Jsc.
The charge recombination process of the two blends was further studied by measuring the dependence of Jsc and Voc on light intensity (Plight). The results are illustrated in Figures 3d and 3e, respectively. The relationship between Jsc and Plight can be described by Jsc∝Plightα, and the α value approaches unity when bimolecular recombination is negligible.[13] The α values of the VG1 and VG2-based devices are extracted to be 0.926 and 0.969, indicating that the intermolecular recombination is lower in VG2-based devices. The relationship between Voc and Plight can be described by the equation of Voc=nkT/qln(Plight),[14] and the n values can be used to evaluate the trap-assisted recombination process. The n values for VG1 and VG2-based devices were calculated to be 1.873 and 1.731, respectively, suggesting the less trap-assisted recombination in VG2- based devices. These results demonstrated that the charge recombination process was reduced by extending the π-conjugation.
To further investigate the Voc differences of these OSCs, the energy loss (Eloss) was quantified by means of electroluminescence external quantum efficiency (EQEEL) experiments. The Eloss of an OSC device consists of three components:[15] ΔE1, which is related to radiative recombination above the bandgap; ΔE2, which refers to radiative recombination below the bandgap; and ΔE3, which represents the non-radiative recombination loss.[16] The Eloss parameters were obtained by an established method.[17] The results are summarized in Table 2. Based on the EQE spectra, the Eg values extracted are 1.382 and 1.371 eV, respectively. Using the equation Eloss=Eg-qVoc, the Eloss values for devices based on VG1 and VG2 are deduced to be 0.684 and 0.592 eV, respectively. Specifically, the ΔE1 values are determined as 0.261 and 0.26 eV, respectively. Regarding ΔE2, VG1 and VG2-based devices demonstrate ΔE2 values of 0.105 and 0.035 eV. Furthermore, ΔE3 can be calculated using the equation ΔE3=(kT/q)ln(1/EQEEL).
The EQEEL values for VG1 and VG2-based devices are measured as 4.36×10⁻⁶ and 9.78×10⁻⁶, respectively, corresponding to ΔE3 values of 0.318 and 0.298 eV. These findings indicate that extending the π-conjugation system mainly suppresses the radiative recombination, leading to reduced energy losses.
The morphologies of the blended films were characterized by atomic force microscopy (AFM). Both blended films show uniform and relatively smooth surface morphologies, with root-mean-square (RMS) values of 1.70 and 1.53 nm for VG1:Y6 and VG2:Y6, respectively. Additionally, phase images show distinct bundle-like fibers in the VG1 and VG2 blend, which demonstrates good film- forming properties.
3 Conclusions
Two novel zigzag-shaped D-A oligomers VG1 and VG2 were synthesized by integrating an electron-rich IDT unit with the V-shaped electron-deficient TPTz unit. These oligomers exhibit good solubility, broad absorption between 300~600 nm, and intense emission near 650 nm. Increasing the number of repeating units in VG2 resulted in a marginally reduced energy bandgap and a significantly enhanced absorption efficiency, attributed to extended conjugation and improved intramolecular charge transfer. Owing to their unique V-shaped geometry, both oligomers formed amorphous thin films. To evaluate their potential as donor materials in OSCs, conventional bulk heterojunction devices were fabricated. The VG2:Y6-based device achie- ved a higher power conversion efficiency (PCE) of 2.56%. This improvement stems from suppressed radiative recombination losses below the bandgap and minimized non- radiative energy losses due to the extended π-conjugation in VG2. These findings highlight the promise of the TPTz unit as a versatile electron-deficient building block for optoelectronic materials, and further exploration is ongoing in our laboratory.
4 Experimental section
4.1 General
Commercially available solvents and reagents were used without further purification unless otherwise noted. 4,7- Dibromo-12,13-bis(octyloxy)triphenyleno[1,2-c:7,8-c']bis- ([1,2,5]thiadiazole) (TPTz) was synthesized according to the reported procedure.[8] Silica gel column chromatography was performed on a Leyan C200012. Thin-layer chromatography (TLC) was carried out on glass sheets coated with silica gel 60 F254 (Leyan C100020). 1H NMR and 13C NMR spectra were recorded at ambient temperature and pressure using a BRUKER AVANCE III, HD 600 MHz spectrometers, and chemical shifts were referenced to CDCl3 (δ=7.26) for 1H NMR and CDCl3 (δ=77.16) for 13C NMR. High-resolution mass spectrometry (HRMS) was carried out on a mass spectrometer (JMS-T100GCV, JEOL). UV/Visible absorption spectra were recorded on a UV-2600i spectrometer. Fluorescence spectra and fluorescence lifetimes were determined by a Horiba Fluoro Max+spectrophotometer. Cyclic voltammetry was performed on a CHI660E electrochemical workstation in dichloromethane (1.0 mmol/L) containing 0.1 mol/L n-Bu4- NPF6 as supporting electrolyte (scan rate: 100 mV•s-1) using ferrocene as an external reference. The surface height images and phase images and roughness of the materials were measured by a Bruker Dimension Fast Scan atomic force microscope (AFM) operating in tapping mode. X-ray diffraction (XRD) characterization was conducted by a Bruker D8 Advance diffractometer, equipped with a Cu Kα radiation source (λ=0.154 nm). The scanning range was set from 1° to 90°, with a scanning rate of 10 (°)•min-1.
4.2 Synthesis
4.2.1 Synthesis of tributyl(4,4,9,9-tetrahexyl-4,9-dihy- dro-s-indaceno[1,2-b:5,6-b']dithiophen-2-yl)stannane (2)
Under N2 atmosphere, to a degassed solution of 4,4,9,9- tetrahexyl-4,9-dihydro-s-indaceno[1,2-b:5,6-b']dithiophene (1, 240 mg, 0.4 mmol) in tetrahydrofuran (THF) (30 mL) was added dropwise n-BuLi (1.6 mol/L in hexane, 0.27 mL, 0.44 mmol) at -78 ℃. After being stirred for 1 h, tributylchlorostannane (1.19 mL, 0.44 mmol) was added to the solution at the same temperature. Then the resulting suspension was stirred at room temperature for 12 h. After the reaction was completed, the mixture was quenched with a saturated aqueous KF solution and the aqueous layer was extracted with dichloromethane. The combined organic layers were washed with water and brine, dried over anhydrous Na2SO4, filtrated and concentrated under reduced pressure to afford 2 as yellow oily liquid, which was used directly in the next step.
4.2.2 Synthesis of 4 and VG1
Under N2 atmosphere, 2 (0.4 mmol), 3 (303 mg, 0.4 mmol), and Pd(PPh3)4 (42 mg, 0.036 mmol) were suspended in a degassed solvent of toluene (30 mL). The resulting suspension was heated to 125 ℃ and stirred for 12 h. After cooled to room temperature, the mixture was quenched with a saturated aqueous KF solution and the aqueous layer was extracted with dichloromethane. The combined organic layers were washed with water and brine, and dried over anhydrous Na2SO4, filtrated and concentrated under reduced pressure. The residue was purified by column chromatography on silica gel (petroleum ether/dichloromethane, V∶V=4∶1) to give 4 as red solid (148 mg, 29%) and VG1 as red solid (129 mg, 18%).
Under N2 atmosphere, 2 (0.4 mmol), 3 (121 mg, 0.16 mmol), and Pd(PPh3)4 (42 mg, 0.036 mmol) were suspended in a degassed solvent of toluene (30 mL). The resulting suspension was heated to 125 ℃ and stirred for 12 h. After cooling to room temperature, the mixture was quenched with a saturated aqueous KF solution, and the aqueous layer was extracted with dichloromethane. The combined organic layers were washed with water and brine, dried over anhydrous Na2SO4, filtrated and concentrated under reduced pressure. The residue was purified by column chromatography on silica gel (petroleum ether/dichloromethane, V∶V=4∶1) to give 4 as red solid (18 mg, 9%) and VG1 as red solid (100 mg, 35%).
4-Bromo-12,13-bis(octyloxy)-7-(4,4,9,9-tetrahexyl-4,9-dihydro-s-indaceno[1,2-b:5,6-b']dithiophen-2-yl)-triphen-yleno[1,2-c:7,8-c']bis([1,2,5]thiadiazole) (4): 1H NMR (600 MHz, CDCl3) δ: 9.79 (s, 1H), 9.53 (s, 1H), 8.42 (s, 1H), 8.29 (s, 1H), 8.24 (s, 1H), 7.51 (s, 1H), 7.42 (s, 1H), 7.35 (d, J=4.6 Hz, 1H), 7.06 (d, J=4.7 Hz, 1H), 4.30 (t, J=6.6 Hz, 2H), 4.24 (t, J=6.7 Hz, 2H), 2.24~2.20 (m, 2H), 2.16~2.01 (m, 10H), 1.74~1.64 (m, 5H), 1.56~1.42 (m, 9H), 1.40~1.35 (m, 8H), 1.28~1.15 (m, 26H), 0.95~0.92 (m, 10H), 0.84~0.77 (m, 12H); 13C NMR (151 MHz, CDCl3) δ: 156.1, 155.6, 153.8, 153.4, 153.2, 152.6, 152.2, 151.7, 150.1, 149.8, 143.2, 141.9, 141.1, 136.6, 135.7, 129.0, 127.1, 126.8, 126.0, 125.1, 125.0, 124.2, 123.4, 122.0, 120.9, 120.3, 113.9, 113.4, 111.5, 108.8, 108.5, 68.5, 68.4, 54.6, 54.0, 39.7, 39.6, 32.1, 32.01, 31.95, 30.2, 30.1, 29.9, 29.73, 29.68, 29.42, 29.36, 26.7, 26.6, 24.7, 24.5, 22.94, 22.92, 22.8, 14.34, 14.33, 14.28, 14.26. HR- MS (ESI) calcd for C74H95BrN4O2S4 1278.552, found 1278.550.
12,13-Bis(octyloxy)-4,7-bis(4,4,9,9-tetrahexyl-4,9-dihy-dro-s-indaceno[1,2-b:5,6-b']dithiophen-2-yl)triphenyleno-[1,2-c:7,8-c']bis([1,2,5]thiadiazole) (VG1): 1H NMR (600 MHz, CDCl3) δ: 10.37 (s, 2H), 9.34 (s, 2H), 8.42 (s, 2H), 7.48 (s, 2H), 7.38 (s, 2H), 7.32 (d, J=4.7 Hz, 2H), 7.01 (d, J=4.7 Hz, 2H), 4.53-4.48 (t, J=6.7 Hz, 4H), 2.22~2.17 (m, 4H), 2.12~2.02 (m, 12H), 1.98~1.93 (m, 4H), 1.70~1.65 (t, J=7.7 Hz, 4H), 1.52~1.46 (m, 6H), 1.45~1.39 (m, 6H), 1.38~1.32 (m, 10H), 1.22~1.11 (m, 44H), 0.94~0.83 (m, 20H), 0.80~0.74 (m, 24H); 13C NMR (151 MHz, CDCl3) δ: 156.5, 155.5, 154.2, 153.6, 153.5, 152.7, 150.2, 142.9, 141.9, 141.6, 136.6, 135.8, 128.0, 126.8, 125.5, 125.4, 123.5, 122.2, 121.8, 121.4, 113.7, 113.4, 109.4, 68.7, 54.6, 54.1, 39.74, 39.67, 32.04, 31.95, 31.91, 30.1, 30.0, 29.8, 29.7, 29.6, 29.1, 26.4, 24.5, 24.4, 22.9, 22.83, 22.81, 14.31, 14.26, 14.23. HRMS (ESI) calcd for C114H152N4O2S6 1802.027, found 1802.080.
4.2.3 Synthesis of VG2
Under N2 atmosphere, 4 (100 mg, 0.078 mmol), 5 (29 mg, 0.31 mmol) and Pd(PPh3)4 (36 mg, 0.031 mmol) were suspended in a degassed solvent of toluene (15 mL). The resulting suspension was heated to 125 ℃ and stirred for 12 h. After cooling to room temperature, the mixture was quenched with a saturated aqueous KF solution, and the aqueous layer was extracted with dichloromethane. The combined organic layers were washed with water and brine, dried over anhydrous Na2SO4, filtrated and concentrated under reduced pressure. The residue was purified by column chromatography on silica gel (petroleum ether/ dichloromethane, V∶V=4∶1) to give 12,13-bis(octyl- oxy)-4,7-bis(4,4,9,9-tetrahexyl-4,9-dihydro-s-indaceno[1, 2-b:5,6-b']dithiophen-2-yl)triphenyleno[1,2-c:7,8-c']bis([1,2,5]thiadiazole) (VG2) as red solid (50.6 mg, 54%). 1H NMR (600 MHz, CDCl3) δ: 10.37 (d, J=2.9 Hz, 4H), 9.35 (d, J=6.4 Hz, 4H), 8.50 (s, 2H), 8.43 (s, 2H), 7.58 (s, 2H), 7.51 (s, 2H), 7.39 (s, 2H), 7.33 (d, J=4.7 Hz, 2H), 7.02 (d, J=4.7 Hz, 2H), 4.51 (d, J=7.0 Hz, 8H), 2.32~2.20 (m, 8H), 2.15~1.96 (m, 24H), 1.71~1.66 (m, 8H), 1.53~1.46 (m, 10H), 1.44~1.40 (m, 8H), 1.38~1.32 (m, 18H), 1.28~1.10 (m, 76H), 1.02~0.96 (m, 8H), 0.94~0.91 (m, 12H), 0.89~0.83 (m, 8H), 0.82~0.74 (m, 36H); 13C NMR (151 MHz, CDCl3) δ: 156.9, 156.4, 155.5, 154.44, 154.36, 153.8, 153.6, 153.5, 152.9, 150.5, 143.3, 142.9, 142.1, 141.9, 141.5, 136.7, 136.6, 135.8, 128.3, 126.9, 125.8, 125.71, 125.65, 123.7, 123.3, 122.5, 122.3, 121.8, 121.7, 113.8, 113.3, 109.7, 69.0, 54.8, 54.6, 54.1, 40.0, 39.8, 39.7, 32.1, 32.0, 31.9, 30.2, 30.11, 30.05, 29.71, 29.69, 29.58, 29.2, 29.1, 26.43, 26.41, 24.6, 24.5, 24.4, 22.9, 22.8, 14.32, 14.30, 14.25. HRMS (ESI) calcd for C188H246N8O4S10 3001.657, found 3001.843.
Supporting Information NMR spectra of 4, VG1 and VG2; XRD profiles, transient fluorescence decay profiles and energy level diagram of VG1 and VG2. The Supporting Information is available free of charge via the Internet at http://sioc-journal.cn/.
(Lu, Y.)