



1 结果与讨论
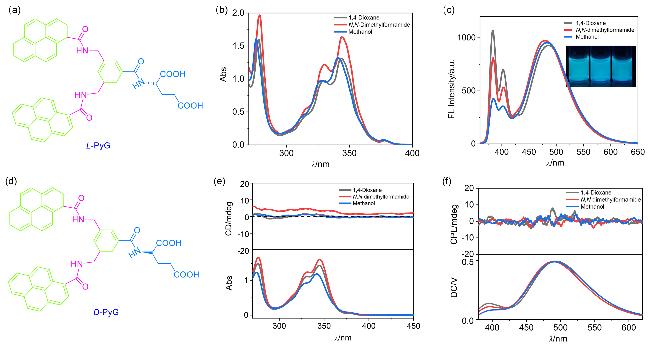
图1 (a) L-PyG的分子结构式; (b) L-PyG在不同溶剂中的UV-vis光谱; (c) L-PyG在不同溶剂中的FL光谱(插图为PyG溶液在365 nm紫外灯下的照片, 从左至右依次为1,4-二氧六环, DMF和MeOH); (d) D-PyG的分子结构式; (e) L-PyG在不同溶剂中的CD光谱; (f) L-PyG在不同溶剂中的CPL光谱Figure 1 (a) Molecular structure of L-PyG; (b) UV-vis spectra of L-PyG in different solvents; (c) FL spectra of L-PyG in different solvents (The inserted images are photographs of PyG in different solution, from left to right: 1,4-dioxane, DMF, MeOH); (d) Molecular structure of D-PyG; (e) CD spectra of L-PyG in different solvents; (f) CPL spectra of L-PyG in different solvents For all measurements, the concentration of PyG was 1.3×10-⁴ mol/L, the cuvette path length was 2 mm, excitation wavelengths for fluorescence and CPL spectra were 340 and 320 nm, respectively. |
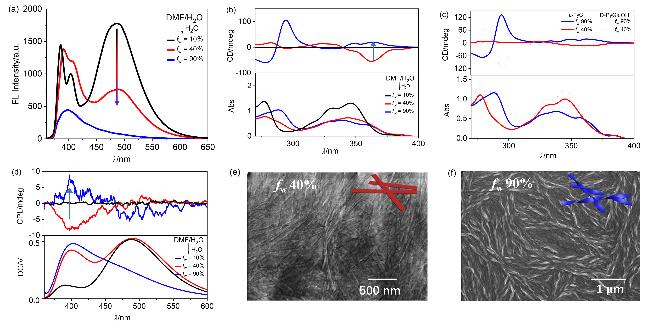
图2 (a) fw从10%到90%的L-PyG组装体的荧光光谱图; (b) fw从10%到90%的L-PyG组装体的CD光谱图; (c) L-PyG(实线)和D-PyG(虚线)组装体在水含量为40%和90%时的CD光谱图; (d) L-PyG组装体fw由10%升高到90%的CPL光谱图; (e) fw=40%的L-PyG组装体扫描电镜图; (f) fw=90%的L-PyG组装体扫描电镜图Figure 2 (a) Fluorescence spectra of L-PyG assemblies with fw ranging from 10% to 90%; (b) CD spectra of L-PyG assemblies with fw ranging from 10% to 90%; (c) CD spectra of L-PyG assemblies and D-PyG assemblies at fw=90% and 40%; (d) CPL spectra of L-PyG assemblies with fw ranging from 10% to 90%; (e) SEM image of L-PyG assemblies at fw=40%; (f) SEM image of L-PyG assemblies at fw=90% [PyG]=3.9×10⁻³ mol/L, cuvette path length 0.1 mm, λex=340 nm and 320 nm for FL and CPL measurements. The blue, red, and black lines represent systems with fw=90%, 40%, and 10%, respectively, while the gray dashed lines correspond to other water fractions. |
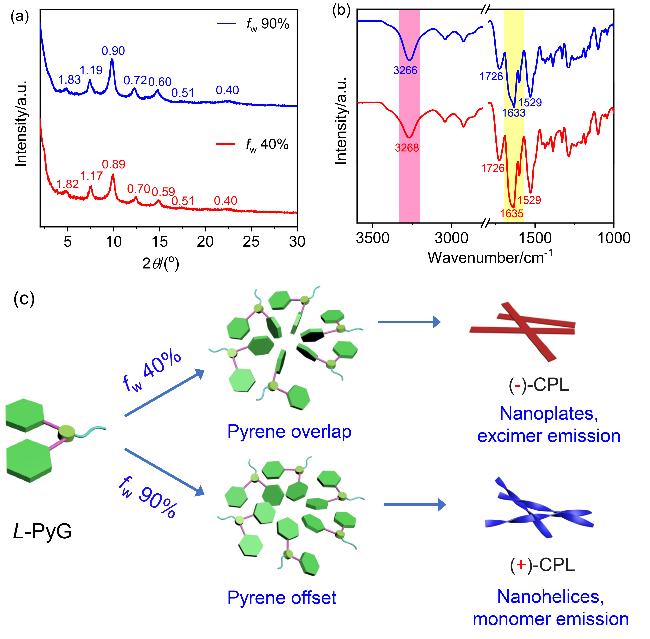
图3 (a) fw=90%(蓝线)和fw=40%(红线)时组装体的PXRD图; (b) fw=90%(蓝线)和fw=40%(红线)时组装体的FT-IR图([PyG]=3.9×10⁻³ mol/L, DMF/H2O混合溶剂); (c)水含量调控的芘发色团堆积与CPL反转机理图Figure 3 (a) PXRD patterns of the assemblies at fw=90% (blue line) and fw=40% (red line); (b) FT-IR spectra of the assemblies at fw=90% (blue line) and fw=40% (red line) ([PyG]=3.9×10⁻³ mol/L in DMF/H2O co-solvents); (c) Schematic ilustration of CPL inversion through water-dependent pyrene stacking |
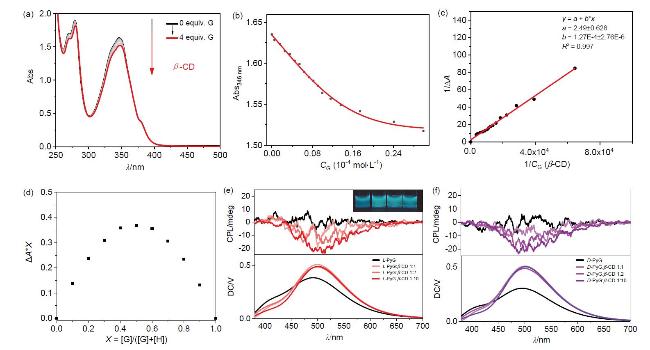


图4 (a) 298 K下PyG的锂盐与β-CD (0~4 equiv.)的UV-vis光谱([PyG]=5.23×10⁻⁵ mol/L, 比色皿光程1 cm); (b)基于图4a的1∶1非线性拟合曲线; (c) Benesi-Hildebrand方程显示1∶1结合模式(结合常数Ka=7.87×10³ L•mol-1); (d) PyG的锂盐与β-CD的紫外可见光谱滴定的Job曲线([PyG]+[β-CD]=5.23×10⁻⁵ mol/L); (e) L-PyG和β-CD (0, 1, 2, 10 equiv.)共组装的CPL光谱(插图: 加入不同物质的量β-CD的样品瓶在365 nm紫外灯下的照片, 从左至右β-CD的用量依次为0, 1, 2, 10 equiv.); (f) D-PyG和不同物质的量的β-CD共组装的CPL光谱([PyG]=2.6×10⁻⁴ mol/L, 比色皿光程为1 cm)Figure 4 (a) UV-vis spectra of PyG lithium salt with gradually added β-CD (0~4 equiv.) at 298 K ([PyG]=5.23×10⁻⁵ mol/L, cuvette path length=1 cm); (b) Nonlinear fitting curve for a 1∶1 binding model based on the data in Figure 4a; (c) Benesi-Hildebrand plot confirming a 1∶1 binding stoichiometry (binding constant Ka=7.87×10³ L•mol-1); (d) Job’s plot for the UV-vis titration of PyG lithium salt with β-CD ([PyG]+[β-CD]=5.23×10⁻5 mol/L); (e) CPL spectra of L-PyG co-assembled with varying equiv. of β-CD (0, 1, 2, 10 equiv.) (Inset: photographs of samples under 365 nm UV light, from left to right: 0, 1, 2, 10 equiv. β-CD); (f) CPL spectra of D-PyG co-assembled with varying equiv. of β-CD ([PyG]=2.6×10⁻⁴ mol/L, cuvette path length=1 cm) |