



1 结果与讨论
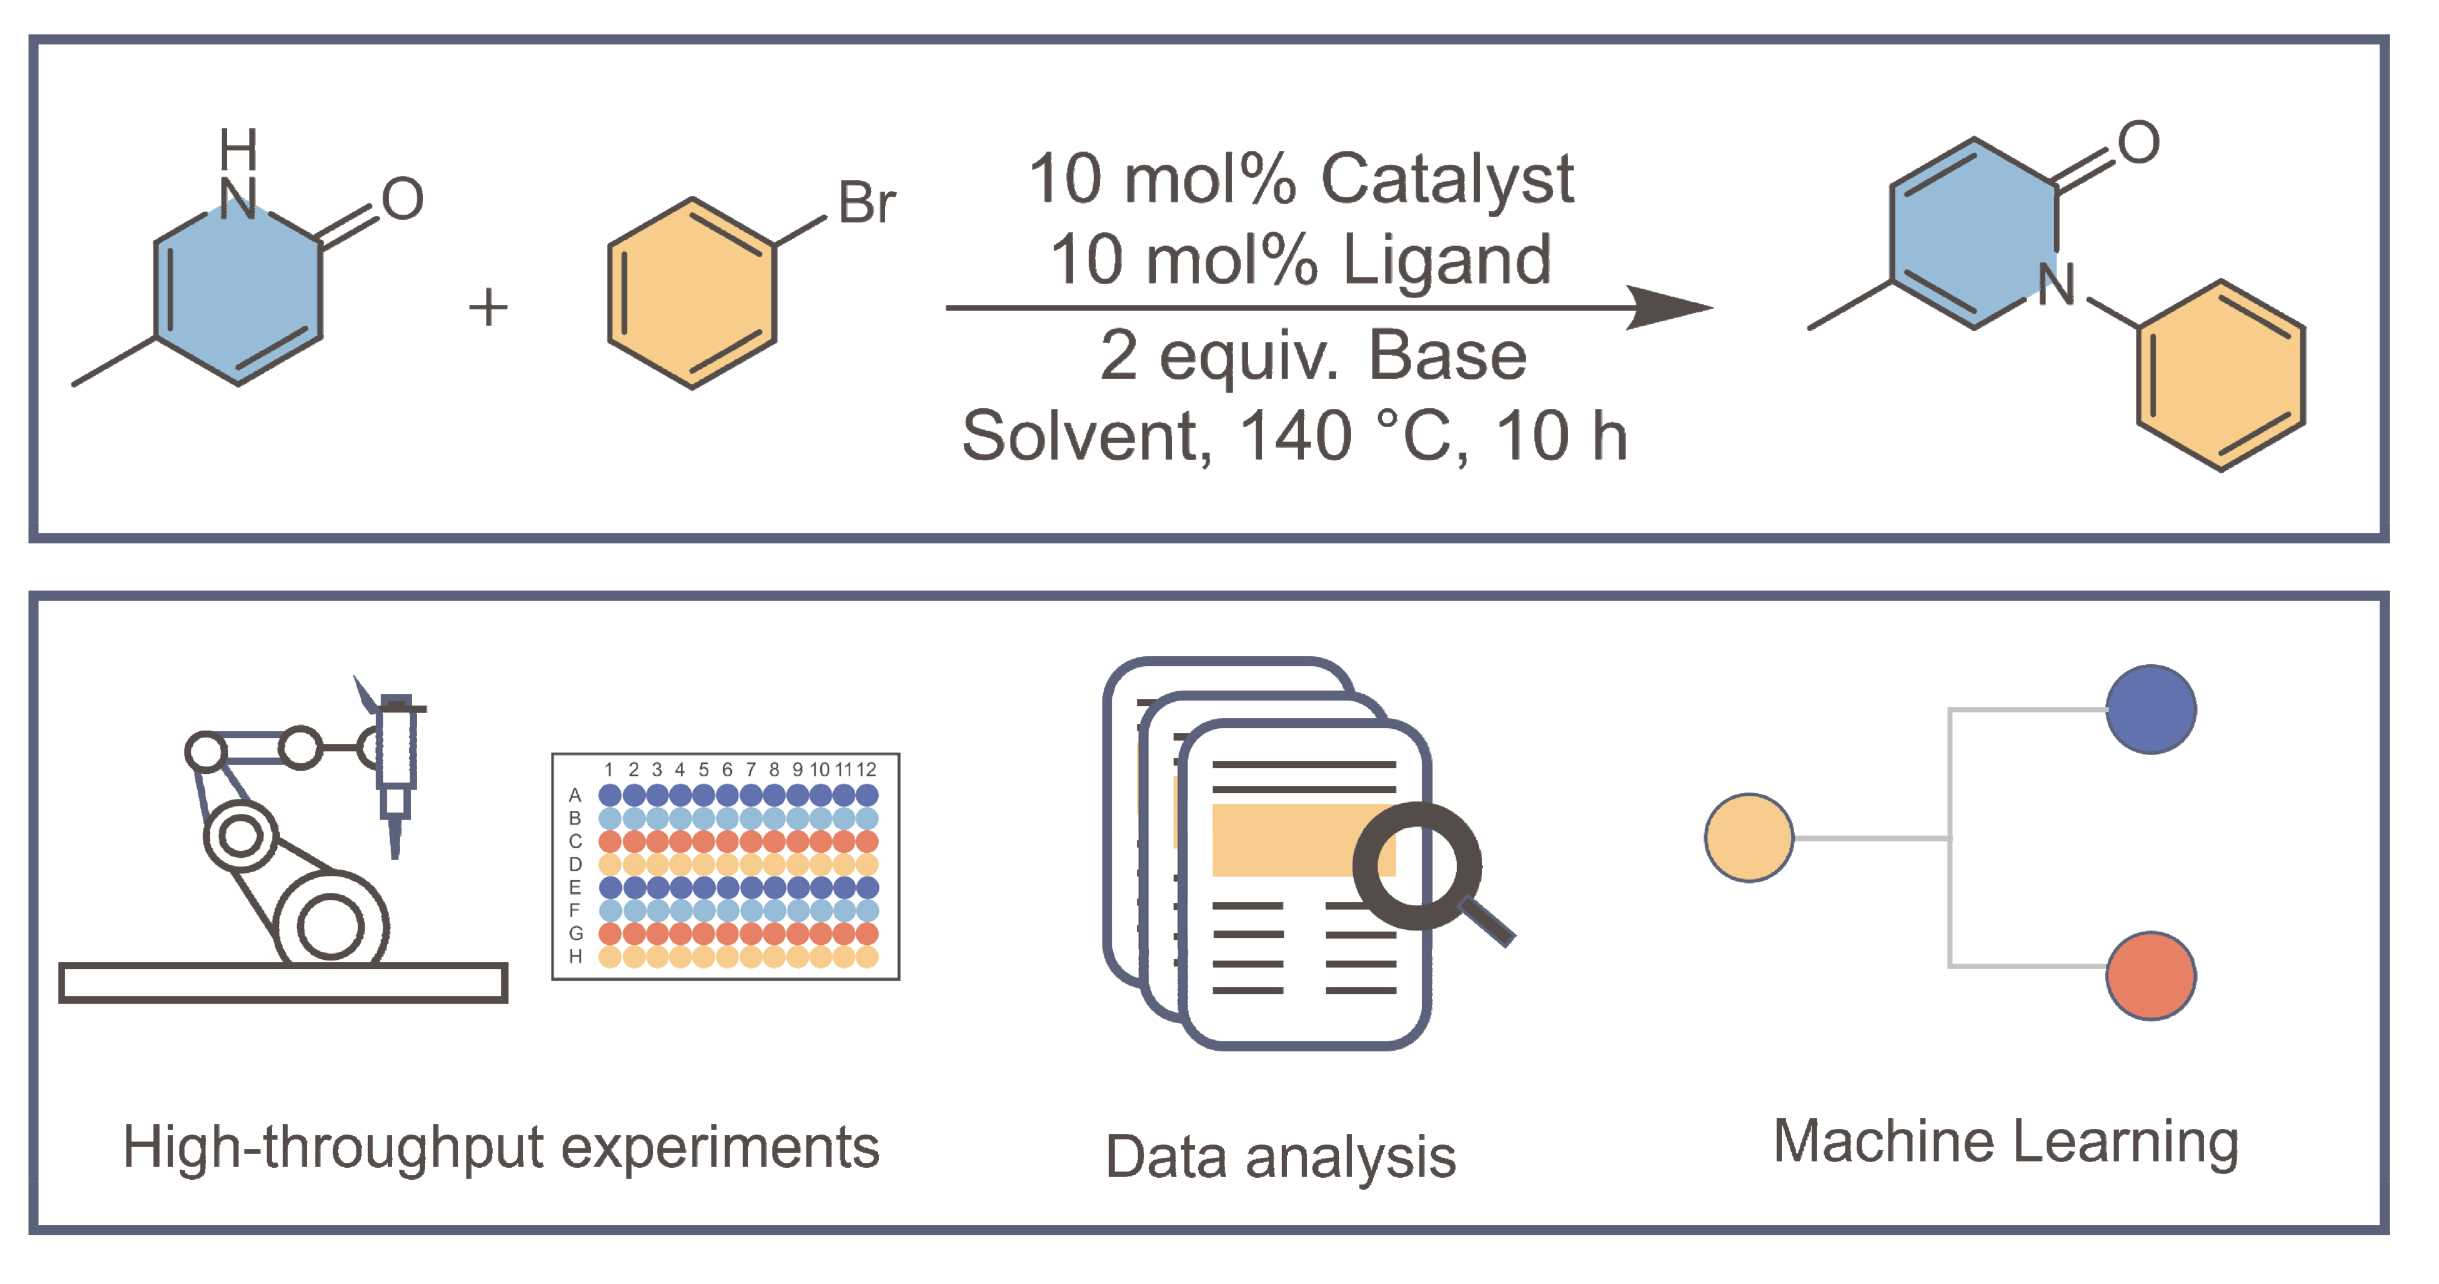
1.1 高通量筛选
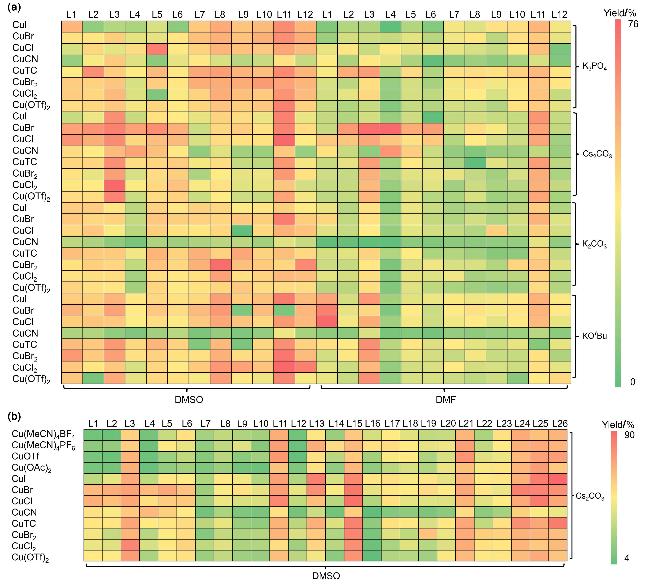
图1 (a)初步筛选的反应产率热图; (b)二次筛选的反应产率热图Figure 1 (a) Heat map of reaction yields of the primary screening; (b) Heat map of reaction yields of the secondary screening Reaction conditions: 2-hydroxy-5-methylpyridine (1.0 equiv.), bromobenzene (1.5 equiv.), catalyst (10 mol%), ligand (10 mol%), base (2.0 equiv.) and solvent (0.6 mL), at 140 ℃ for 10 h. The yield of the product was determined by HPLC using 1,3,5-trimethoxybenzene as an internal standard |
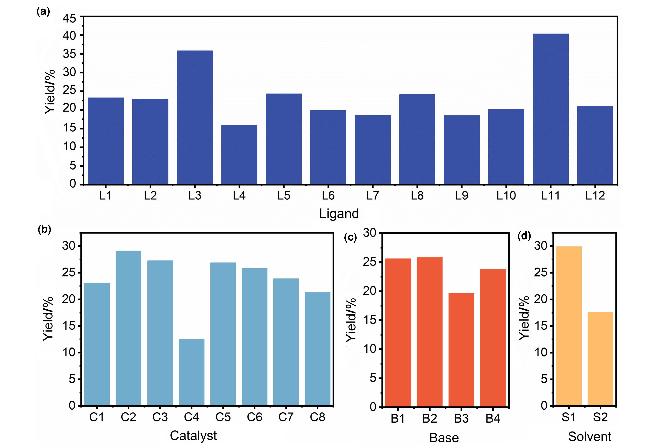
图2 (a)初步筛选不同配体的平均产率; (b)初步筛选不同催化剂的平均产率; (c)初步筛选不同碱的平均产率; (d)初步筛选不同溶剂的平均产率Figure 2 (a) Average yields of different ligands in preliminary screening; (b) average yields of different catalysts in preliminary screening; (c) average yields of different bases in preliminary screening; (d) average yields of different solvents in preliminary screening |
1.2 结合机器学习的规律性分析
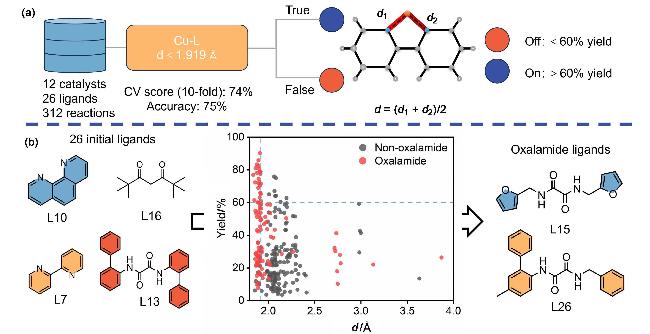
图3 (a)决策树分类模型及其将Ullmann C-N偶联的催化剂-配体组合分类为开启或关闭反应性的准确性; (b)使用Cu-L计算的相互作用距离(d)分析数据Figure 3 (a) Decision tree classification model and its accuracy in classifying catalyst-ligand combinations as “on” or “off” reactive states in the Ullmann C-N coupling reaction; (b) correlation between reaction yield and the Cu-L interaction distance (d) Red dots represent oxamide ligands, black dots represent non-oxamide ligands. The vertical dashed lines indicate the 60% yield threshold distinguishing “on/off” reactivity and the calculated d threshold of 1.919 Å, highlighting the significance of d in determining reaction yield |
1.3 统计分析
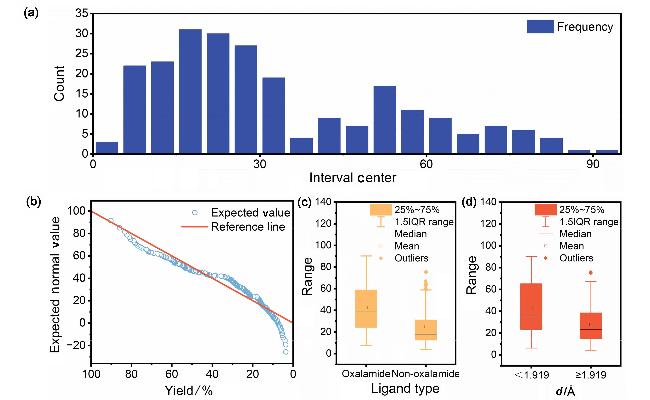


图4 (a)产率的分布直方图; (b)产率的正态Q-Q图, 红线对角线为正态参照线; (c)配体类型对产率的影响, 对于草酰胺和非草酰胺两类配体的产率分布; (d) Cu-L相互作用距离(d值)对产率的影响, 对于d<1.919 Å和d≥1.919 Å两类组合的产率分布Figure 4 (a) Distribution histogram of yield; (b) normal Q-Q plot of yields, the red diagonal line is the normal reference line; (c) the effect of ligand type on yield, the yield distribution of oxamide and non-oxamide ligands; (d) the effect of Cu-L interaction distance (d value) on yield, the yield distribution of the two combinations of d<1.919 Å and d≥1.919 Å |