

1 结果与讨论
1.1 DCA-Tcf对${\text{HSO}}_{3}^{-}$的选择性和抗干扰性能研究
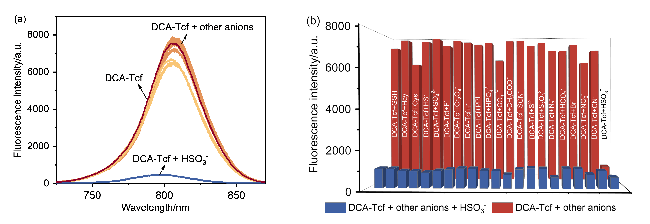
图1 (a) DCA-Tcf (10 μmol/L)在EtOH/PBS (V∶V=5∶5, pH=7.4)体系中加入500 μmol/L不同分析物(Br-、I-、$\mathrm{NO}_{2}^{-}$、$\mathrm{CO}_{3}^{2-}$、$\mathrm{HCO}_{3}^{-} 、 \mathrm{CH}_{3} \mathrm{COO}^{-} 、 \mathrm{HPO}_{4}^{2-} 、 \mathrm{~S}^{2-} 、 \mathrm{PO}_{4}^{3-} 、 \mathrm{CN}^{-} 、 \mathrm{SCN}^{-} 、 \mathrm{PPi} 、 \mathrm{SO}_{4}^{2-} 、 \mathrm{HSO}_{3}^{-} 、 \mathrm{~N}_{3}^{-} 、 \mathrm{Hcy} 、 \mathrm{GSH} 、 \mathrm{Cys} $和$\mathrm{HSO}_{4}^{-}$)后的荧光光谱变化; (b)探针加入不同分析物后继续加入${\text{HSO}}_{3}^{-}$在809 nm处的荧光强度变化(λex=690 nm)Figure 1 (a) Fluorescence spectral changes of DCA-Tcf (10 μmol/L) in EtOH/PBS solution (V∶V=5∶5, pH=7.4) addition of various analytes (Br-, I-, $\mathrm{NO}_{2}^{-}$、$\mathrm{CO}_{3}^{2-}$、$\mathrm{HCO}_{3}^{-} 、 \mathrm{CH}_{3} \mathrm{COO}^{-} 、 \mathrm{HPO}_{4}^{2-} 、 \mathrm{~S}^{2-} 、 \mathrm{PO}_{4}^{3-} 、 \mathrm{CN}^{-} 、 \mathrm{SCN}^{-} 、 \mathrm{PPi} 、 \mathrm{SO}_{4}^{2-} 、 \mathrm{HSO}_{3}^{-} 、 \mathrm{~N}_{3}^{-} 、 \mathrm{Hcy} 、 \mathrm{GSH} 、 \mathrm{Cys} $ and $\mathrm{HSO}_{4}^{-}$, 500 μmol/L); (b) Fluorescence intensity changes at 809 nm of DCA-Tcf (10 μmol/L) solution addition of various analytes and further adding ${\text{HSO}}_{3}^{-}$ (λex=690 nm) |
1.2 DCA-Tcf检测${\text{HSO}}_{3}^{-}$的影响因素
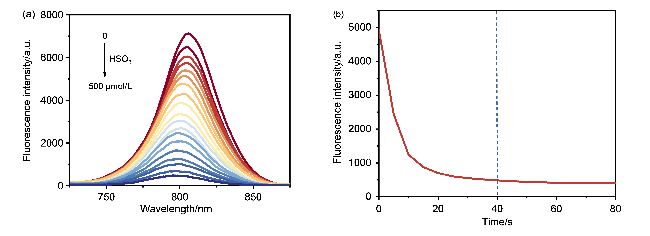
图2 (a) DCA-Tcf (10 μmol/L)的EtOH/PBS (V∶V=5∶5, pH=7.4)溶液随${\text{HSO}}_{3}^{-}$浓度增加(0~500 μmol/L)的荧光光谱变化; (b)加入500 μmol/L ${\text{HSO}}_{3}^{-}$后DCA-Tcf溶液在809 nm处的荧光强度随时间变化曲线(λex=690 nm)Figure 2 (a) Fluorescence spectral changes of DCA-Tcf (10 μmol/L) in EtOH/PBS solution (V∶V=5∶5, pH=7.4) upon the addition of varying concentrations of ${\text{HSO}}_{3}^{-}$ (0~500 μmol/L); (b) Time-dependent fluorescence intensity curve of DCA-Tcf solution at 809 nm after the addition of 500 μmol/L ${\text{HSO}}_{3}^{-}$ (λex=690 nm) |
1.3 DCA-Tcf识别${\text{HSO}}_{3}^{-}$的机理
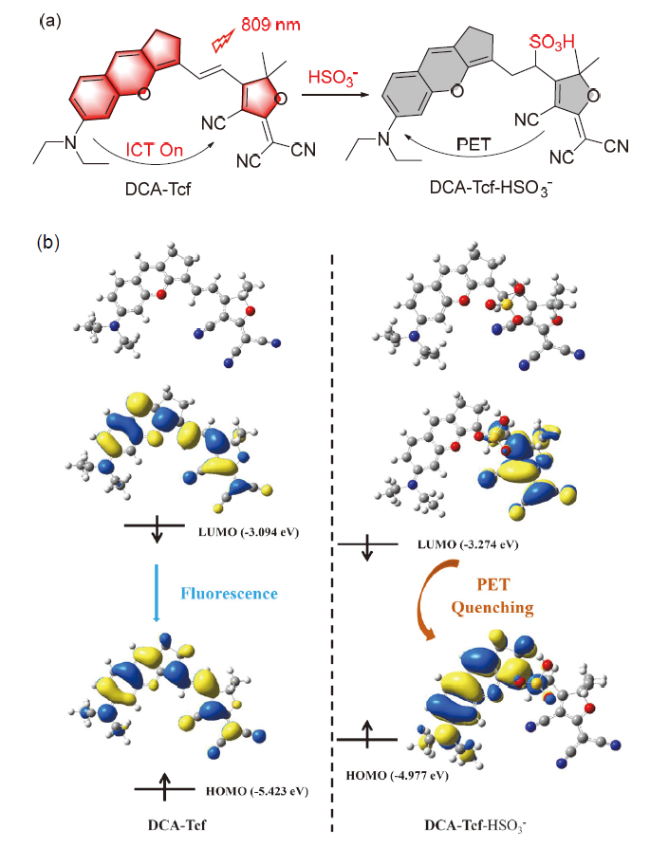
图3 (a) DCA-Tcf对${\text{HSO}}_{3}^{-}$的识别机制; (b) DCA-Tcf及DCA-Tcf-${\text{HSO}}_{3}^{-}$在S1态下的优化构型及前沿分子轨道电子跃迁示意图Figure 3 (a) Recognition mechanism of DCA-Tcf for ${\text{HSO}}_{3}^{-}$; (b) Optimized configurations and schematic diagrams of the frontier molecular orbital electronic transitions of DCA-Tcf and DCA-Tcf-${\text{HSO}}_{3}^{-}$ in the S1 state |
1.4 DCA-Tcf在食品样品和实际水样中检测${\text{HSO}}_{3}^{-}$
表1 DCA-Tcf检测白砂糖、自来水、湖水和河水中${\text{HSO}}_{3}^{-}$浓度的结果aTable 1 Results of DCA-Tcf detection of ${\text{HSO}}_{3}^{-}$ concentration in white sugar, tap water, lake water, and river water |
| Sample | c/(μmol•L-1) | Recovery/% | RSD/% (n=3) | |
|---|---|---|---|---|
| Added | Found | |||
| Granulated sugar 1 | 5 | 5.12 | 102.41 | 0.18 |
| 6 | 6.09 | 101.50 | 0.06 | |
| 7 | 6.97 | 99.57 | 0.08 | |
| Granulated sugar 2 | 5 | 4.88 | 97.60 | 0.09 |
| 6 | 6.23 | 103.83 | 0.09 | |
| 7 | 7.19 | 102.71 | 0.15 | |
| Tap water | 5 | 5.23 | 104.58 | 0.23 |
| 6 | 6.43 | 107.17 | 0.40 | |
| 7 | 7.19 | 102.67 | 0.31 | |
| Lake water | 5 | 4.94 | 98.81 | 0.30 |
| 6 | 6.09 | 101.55 | 0.45 | |
| 7 | 7.14 | 101.97 | 0.15 | |
| River water | 5 | 5.22 | 104.40 | 0.39 |
| 6 | 6.14 | 102.27 | 0.18 | |
| 7 | 6.95 | 99.31 | 0.13 | |
a Data are representative of three independent experiments. |
1.5 DCA-Tcf对活细胞中${\text{HSO}}_{3}^{-}$成像
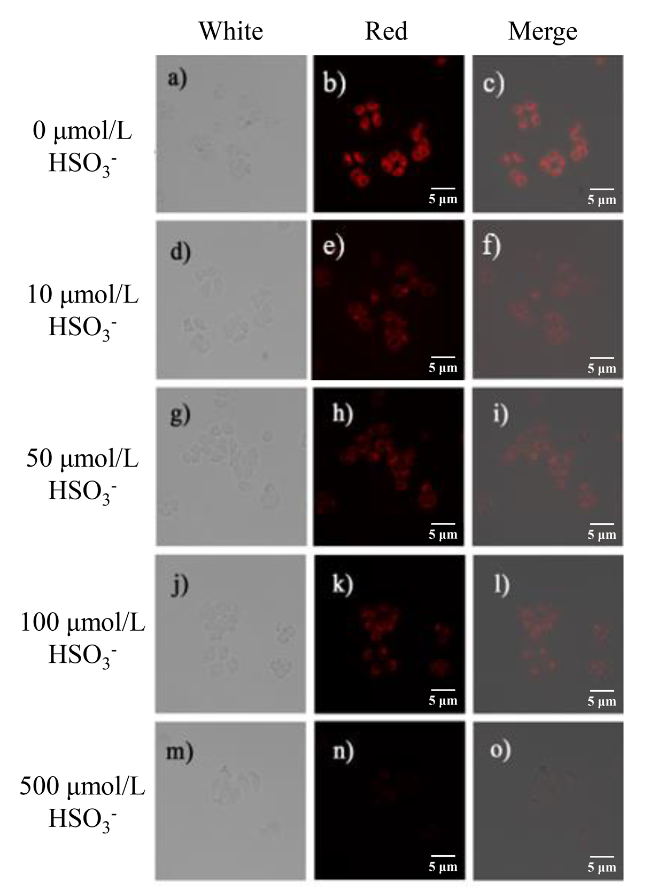


图4 MCF-7细胞在37 ℃下加入DCA-Tcf (10 μmol/L), 再加入不同浓度${\text{HSO}}_{3}^{-}$孵育后的荧光图Figure 4 Fluorescence images of MCF-7 cells incubated with DCA-Tcf (10 μmol/L) and various concentrations of ${\text{HSO}}_{3}^{-}$at 37 ℃ Bright-field (a, d, g, j, m), dark-field (b, e, h, k, n), and overlay images (c, f, i, l, o). |