1 机器学习的基本流程
1.1 数据准备
1.2 分子表征与特征工程
1.3 算法模型选择
1.4 模型评估与解释
2 性质预测的研究进展
2.1 临界胶束浓度(CMC)的预测
表1 临界胶束浓度预测任务及结果Table 1 Task and results of critical micelle concentration prediction |
| Authors | Year | Algorithm | Features/Descriptors | Dataset size | Surfactant type | R2 (Test) | RMSE (log CMC, mol/L) (Test) |
|---|---|---|---|---|---|---|---|
| Specific-type models | |||||||
| Gaudin et al.[13] | 2016 | MLR | Integral; topological, compositional, and fragment descriptors | 83 | Sugar-based | 0.910 | 0.320 |
| Wang et al.[45] | 2019 | MLR | Norm descriptors | 101 | Anionic | 0.913 | 0.257 |
| Jiao et al.[46] | 2020 | PLS | Holographic fragment fingerprints | 120 | Gemini (anionic/ cationic) | 0.980 | 0.176 |
| Setiawan et al.[47] | 2021 | Consensus | Dragon/CDK/ISIDA descriptors | 231 | Gemini cationic | 0.870 | 0.350 |
| Creton et al.[48] | 2022 | SVM | Functional group descriptors | 254a | PFAS+conven- tional surfactants | 0.899 | 0.273 |
| General models | |||||||
| Zavala et al.[49] | 2021 | GCN | Molecular graphs | 202 | All typesᵈ | 0.920 | 0.300 |
| Seddon et al.[50] | 2022 | XGB | 3D descriptors+physical constraints | 154 | All types | 0.870 | - |
| Striolo et al.[30] | 2023 | GPs-GNN | Molecular graphs | 202+43 | All types | - | 0.210 |
| Boukelkal et al.[51] | 2024 | DA-SVR | Dragon/Mordred descriptors+temperature | 593 | All types | 0.986 | 0.144 |
| Mitsos et al.[52] | 2024 | GNN | Molecular graphs | 429 | All types | 0.940 | 0.280 |
| Mitsos et al.[53] | 2024 | GNN | Molecular graphs+ temperature | 1375b | All types (multi-task) | 0.950 | 0.240 |
| Ge et al.[54] | 2024 | LGBM (ionic)+ GBDT (nonionic) | Descriptors+ temperature+PCA classification | 779 | All types | 0.944 | 0.284 |
| Robinson et al.[55] | 2025 | AttentiveFP | Molecular graphs | 1395 | All types (multi-task) | — | 0.346 |
| Complex conditions & mixture systems | |||||||
| Ham et al.[56] | 2024 | GNN | Molecular graphs, MD simulations, geometric descriptors | 92 | All types (multi-task) | 0.900 | 0.280 |
| Barbosa et al.[57] | 2025 | FNN | DFT-derived features+ temperature | 1377 | All types | 0.950 | 0.380 |
| Mitsos et al.[58] | 2025 | Combined-GNN | Hybrid graphs, mole fraction, temperature | 1924c | Binary mixtures | 0.930 | 0.249 |
| Choudhary et al.[59] | 2025 | ANN | Descriptor fusion | 979 | Binary mixtures | 0.941 | 0.315 |
a 55 PFAS and 199 non-fluorinated surfactants;b1377 data points for 429 surfactants (0-90 °C);c monocomponent (1409) and binary systems (515) (0-90 °C);dall types, including ionic (anionic/cationic), nonionic, and zwitterionic surfactants. |
2.1.1 特定类型表面活性剂的机理与预测
2.1.2 通用模型与数据库集成
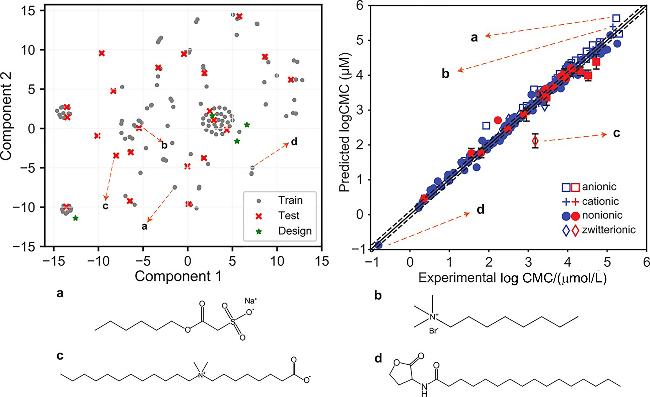
图4 图卷积神经网络对所有类型表面活性剂的预测结果Figure 4 GCN predictions for all classes of surfactants Left: low-dimensional distribution of surfactant fingerprints using t-SNE. The test samples (red crosses) are widespread, and most of the designed surfactants (green points) fall outside the clusters of existing dataset. Right: parity plot between the predicted and experimental log CMC values (training data in blue and test data in red). The test set achieved a coefficient of determination (R²) of 0.92 with a root mean square error (RMSE) of 0.30 (log scale). Molecular structures are shown for the selected extreme points: Structure a is an anionic surfactant (minor outlier) with a high log CMC value; Structure b is a cationic surfactant (minor outlier) with a high log CMC value; Structure c is a zwitterionic surfactant (major outlier); Structure d is a nonionic surfactant with a low log CMC value.[49] Copyright (2021) American Chemical Society. |
2.1.3 复杂条件与混合体系的预测模型
2.2 临界胶束浓度下表面张力(γCMC/SFT)的预测
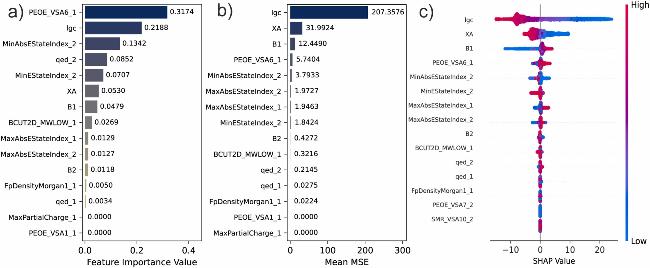
图5 混合表面活性剂表面张力预测模型的多尺度特征重要性分析Figure 5 Multiscale feature importance analysis of surface tension prediction models for mixed surfactants (a) Feature importance ranking based on XGBoost model weights, displaying the top 15 key features; (b) Permutation importance analysis (PEI) quantifying feature impacts on model performance (MSE) through 100 Monte Carlo perturbations; (c) SHAP value analysis elucidating both direction and magnitude of marginal contributions of features to predictions.[77] Copyright (2025) Elsevier B.V. |
表2 临界胶束浓度下表面张力预测任务及结果Table 2 Prediction task and results of surface tension at critical micelle concentration |
| Authors | Year | Algorithm | Features/Descriptors | Dataset size | Data description | R2 (Test) | RMSE (mN/m) (Test) |
|---|---|---|---|---|---|---|---|
| Gaudin et al.[73] | 2018 | MLR | Quantum chemical descriptors | 70 | Sugar-based nonionic surfactants (cyclic/non-cyclic head groups; linear/branched/unsaturated chains) | 0.780 | 2.400 |
| Hemmati-Sarapardeh et al.[76] | 2023 | GBRT | Temperature, n-alkane molecular weight, concentration, HLB, PIT | 390 | Five ionic surfactants (C10TAB, C12TAB, C14TAB, C16TAB, SDS) | 0.985 | 1.628 |
| Pradilla et al.[67] | 2023 | RF | 37 manually defined molecular descriptors | 691+9 | 691 conventional surfactants+ 9 amino acids | 0.550 | 4.720 |
| Saeedi Dehaghani et al.[74] | 2023 | SGBT | Temperature, mole fraction, molecular weight, density, boiling point, etc. | 4010 | 122 binary mixtures (48 ionic liquids+20 nonionic liquids) | 0.993 | 0.001 |
| Ham et al.[56] | 2024 | GNN | Molecular graphs, MD simulations, geometric descriptors | 92 | Anionic, cationic, nonionic, and zwitterionic surfactants | 0.900 | 2.640 |
| Robinson et al.[55] | 2025 | Attentive FP | Molecular graphs | 972 | Anionic, cationic, nonionic, and zwitterionic surfactants | – | 3.407 |
| Ge et al.[77] | 2025 | XGBoost | Mole fraction, log concentration, interaction parameters, molecular descriptors | 1135 | Polyether nonionic surfactants+four representative surfactants (SDS, CTAB, TX100, BS12) | 0.999 | 0.260a |
a Ge et al. (2025) reported an MSE value of 0.0676, which is converted here to RMSE. $ R M S E=\sqrt{0.0676} \approx 0.260$. |
2.3 吸附效率(pC20)的预测
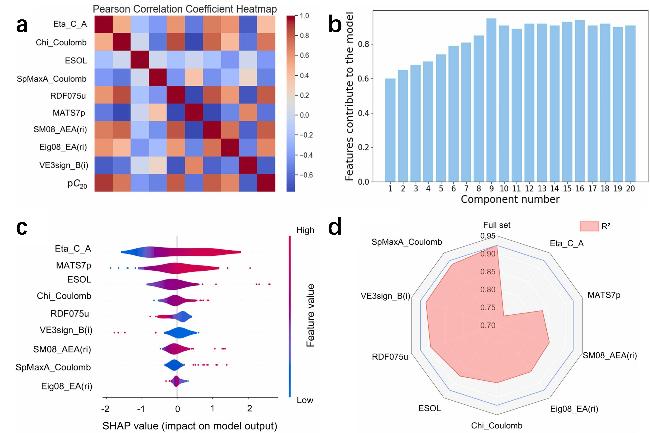
图6 特征选择与重要性分析Figure 6 Feature selection and importance analysis (a) Feature correlation heatmap analysis; (b) Cumulative variance contribution rate of principal component analysis (The cumulative contribution rate of the first nine principal components exceeds 90%, while increasing the number of principal components yields no significant improvement, indicating that the first nine principal components are sufficient to retain the vast majority of data information); (c) SHAP feature importance evaluation; (d) LOFO analysis revealing contributions and synergistic effects of key descriptors (ETA_C_A, MATS7p, etc.).[82] Copyright (2025) Elsevier B.V. |
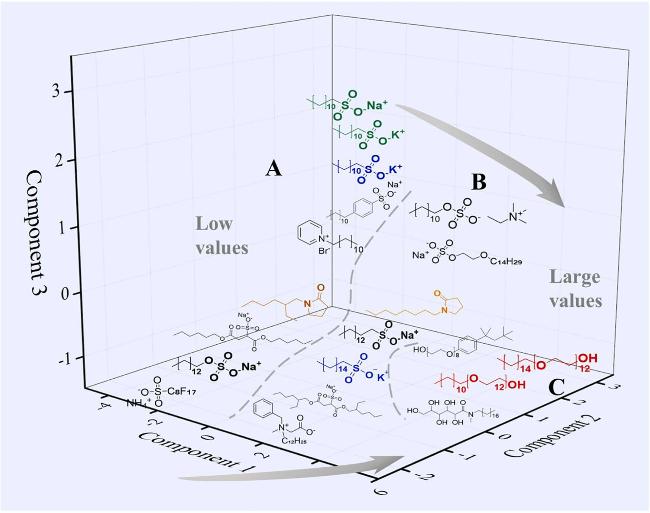
图7 表面活性剂结构-效率关系的3D可视化Figure 7 3D visualization of structure-efficiency relationship of surfactants The clustering results based on PCA dimensionality reduction reveal an increasing trend of pC20 values along the arrow direction. Zones A, B, and C correspond to low, medium, and high adsorption efficiencies, respectively, with structural modifications (e.g., chain length variation, headgroup type) governing the spatial distribution patterns of molecules.[82] Copyright (2025) Elsevier B.V. |