

1 引言
2 结果与讨论
2.1 不同酸碱度机制纸的制备
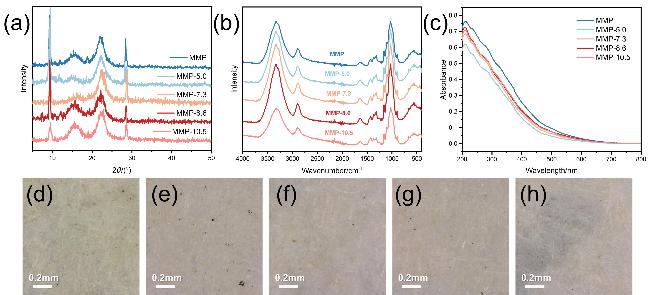
图1 (a) MMP、MMP-5.0、MMP-7.3、MMP-8.6和MMP-10.5的XRD图谱; (b) MMP、MMP-5.0、MMP-7.3、MMP-8.6和MMP-10.5的IR图谱; (c) MMP、MMP-5.0、MMP-7.3、MMP-8.6和MMP-10.5的UV-Vis图谱; (d) MMP、(e) MMP-5.0、(f) MMP-7.3、(g) MMP-8.6和(h) MMP-10.5的数码图片Figure 1 (a) XRD patterns of MMP, MMP-5.0, MMP-7.3, MMP-8.6 and MMP-10.5; (b) IR spectra of MMP, MMP-5.0, MMP-7.3, MMP-8.6 and MMP-10.5; (c) UV-Vis spectra of MMP, MMP-5.0, MMP-7.3, MMP-8.6 and MMP-10.5; Digital images of (d) MMP, (e) MMP-5.0, (f) MMP-7.3, (g) MMP-8.6 and (h) MMP-10.5 |
2.2 不同酸碱度纸张的降解动力学
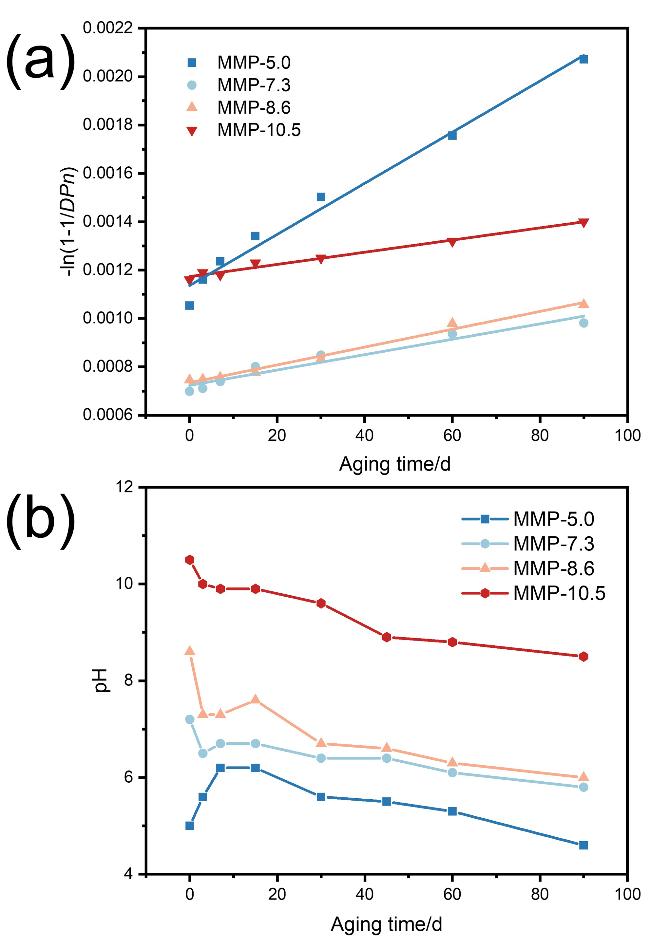
图2 (a)加速干热老化前后MMP-5.0、MMP-7.3、MMP-8.6和MMP-10.5的ln(1–1/DPn)随老化时间变化图; (b)加速干热老化前后MMP-5.0、MMP-7.3、MMP-8.6和MMP-10.5表面pH值随老化时间变化图Figure 2 (a) ln(1–1/DPn) as a function of aging time for MMP-5.0, MMP-7.3, MMP-8.6 and MMP-10.5 before and after accelerated dry-heat aging; (b) the variation of surface pH with aging time for MMP-5.0, MMP-7.3, MMP-8.6, and MMP-10.5 before and after accelerated dry-heat aging |
2.3 不同酸碱度纸张的老化后综合性能变化
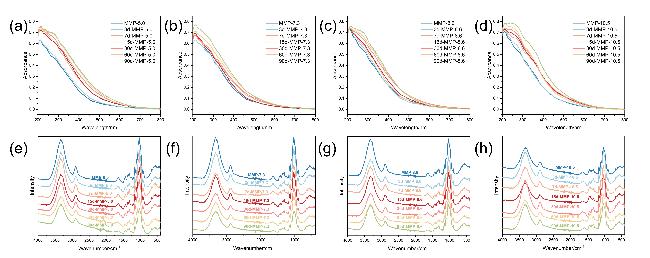
图3 老化前后(a) MMP-5.0, (b) MMP-7.3, (c) MMP-8.6和(d) MMP-10.5的UV-Vis图谱; 老化前后(e) MMP-5.0, (f) MMP-7.3, (g) MMP-8.6和(h) MMP-10.5的IR图谱Figure 3 UV-Vis spectra of (a) MMP-5.0, (b) MMP-7.3, (c) MMP-8.6 and (d) MMP-10.5 before and after aging; IR spectra of (e) MMP-5.0, (f) MMP-7.3, (g) MMP-8.6 and (h) MMP-10.5 before and after aging |
表1 不同酸碱性样品在不同加速老化时间下的OIUV-VisTable 1 OIUV-Vis of samples with different pH values at various accelerated aging time |
| Aging time/d | OIUV-Vis | |||
|---|---|---|---|---|
| MMP-5.0 | MMP-7.3 | MMP-8.6 | MMP-10.5 | |
| 0 | 1 | 1 | 1 | 1 |
| 3 | 1.04 | 0.99 | 1.01 | 1.02 |
| 7 | 1.39 | 1.10 | 1.07 | 1.26 |
| 15 | 1.40 | 1.06 | 1.11 | 1.27 |
| 30 | 1.50 | 1.15 | 1.25 | 1.29 |
| 60 | 1.59 | 1.25 | 1.27 | 1.29 |
| 90 | 1.63 | 1.33 | 1.29 | 1.50 |
表2 不同酸碱性样品在不同加速老化时间下的OIIRTable 2 OIIR of samples with different pH values at various accelerated aging time |
| Aging time/d | OIIR | |||
|---|---|---|---|---|
| MMP-5.0 | MMP-7.3 | MMP-8.6 | MMP-10.5 | |
| 0 | 1 | 1 | 1 | 1 |
| 3 | 1.09 | 1.22 | 1.10 | 1.08 |
| 7 | 1.06 | 1.84 | 1.54 | 1.03 |
| 15 | 1.16 | 1.32 | 1.20 | 0.71 |
| 30 | 1.53 | 1.94 | 1.31 | 0.92 |
| 60 | 2.58 | 2.26 | 1.74 | 0.82 |
| 90 | 2.71 | 1.42 | 1.08 | 0.80 |
表3 不同酸碱度样品在不同加速老化时间下的色差数据Table 3 Color difference of samples with different pH values at various accelerated aging time |
| Sample | Aging time/d | ΔL* | Δa* | Δb* | ΔE* |
|---|---|---|---|---|---|
| MMP | 0 | –6.88 | 4.06 | 11.20 | 13.76 |
| MMP-5.0 | 0 | –5.69 | 2.93 | 8.26 | 10.45 |
| 3 | –9.26 | 2.67 | 8.15 | 12.62 | |
| 7 | –8.83 | 3.20 | 9.76 | 13.54 | |
| 15 | –9.37 | 4.15 | 12.41 | 16.09 | |
| 30 | –10.03 | 4.62 | 13.12 | 17.15 | |
| 60 | –10.67 | 6.38 | 16.06 | 20.31 | |
| 90 | –10.98 | 7.02 | 16.85 | 21.30 | |
| MMP-7.3 | 0 | –8.72 | 2.30 | 6.93 | 11.37 |
| 3 | –8.48 | 3.60 | 9.77 | 13.43 | |
| 7 | –8.73 | 3.88 | 10.91 | 14.50 | |
| 15 | –10.02 | 3.12 | 9.85 | 14.40 | |
| 30 | –9.71 | 4.08 | 11.76 | 15.79 | |
| 60 | –9.10 | 4.94 | 13.36 | 16.90 | |
| 90 | –9.30 | 5.60 | 15.81 | 19.18 | |
| MMP-8.6 | 0 | –9.84 | 2.60 | 6.88 | 12.28 |
| 3 | –8.91 | 3.28 | 9.70 | 13.57 | |
| 7 | –7.49 | 4.38 | 12.20 | 14.97 | |
| 15 | –8.93 | 3.57 | 10.99 | 14.60 | |
| 30 | –7.43 | 4.68 | 12.85 | 15.56 | |
| 60 | –8.75 | 5.20 | 14.23 | 17.50 | |
| 90 | –9.15 | 5.92 | 15.44 | 18.90 | |
| MMP-10.5 | 0 | –7.79 | 2.92 | 8.05 | 11.58 |
| 3 | –8.91 | 4.40 | 11.19 | 14.97 | |
| 7 | –11.84 | 4.17 | 10.15 | 16.14 | |
| 15 | –13.14 | 4.81 | 11.69 | 18.23 | |
| 30 | –9.17 | 5.00 | 13.10 | 16.76 | |
| 60 | –10.95 | 5.25 | 14.06 | 18.58 | |
| 90 | –10.77 | 6.40 | 16.40 | 20.64 |
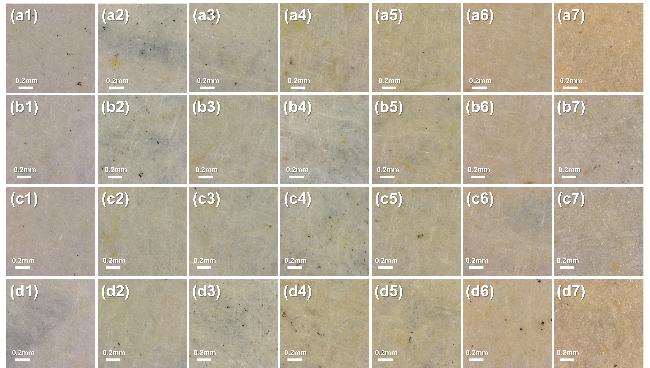
图4 不同加速老化时间下(a) MMP-5.0, (b) MMP-7.3, (c) MMP-8.6和(d) MMP-10.5的数码图片. 从左至右分别对应0、3、7、15、30、60、90 dFigure 4 Digital images of (a) MMP-5.0, (b) MMP-7.3, (c) MMP-8.6 and (d) MMP-10.5 at different accelerated aging time. From left to right, they correspond to 0, 3, 7, 15, 30, 60, and 90 d, respectively |