


1 引言
2 结果与讨论
2.1 SBE-β-CD与阳离子双子表面活性剂形成液液凝聚相的条件
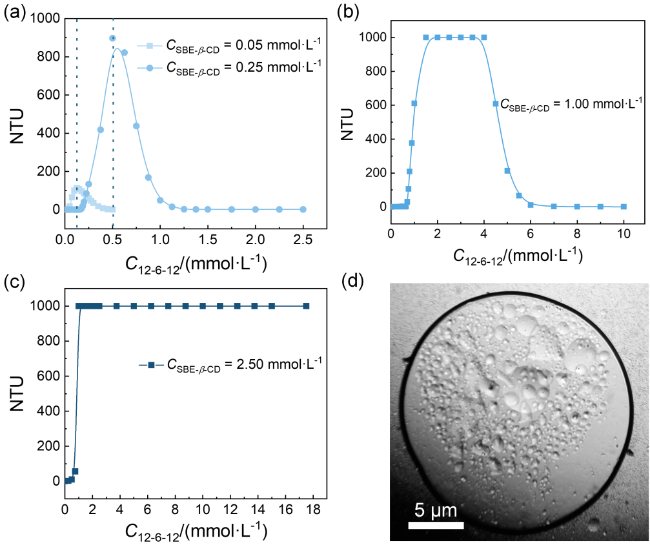
图2 SBE-β-CD/12-6-12体系浊度随12-6-12浓度的变化曲线. SBE-β-CD浓度分别固定为0.05 mmol•L−1和0.25 mmol•L−1 (a), 1.00 mmol•L−1 (b)以及2.50 mmol•L−1 (c). (d)复合体系形成的白色乳状液显微镜照片Figure 2 Turbidity curves of SBE-β-CD/12-6-12 systems as a function of 12-6-12 concentration. The concentration of SBE-β-CD is fixed at 0.05 mmol•L−1 and 0.25 mmol•L−1 (a), 1.00 mmol•L−1 (b), and 2.50 mmol•L−1 (c), respectively. (d) A microscopic photograph of the white solution formed by the complex system |
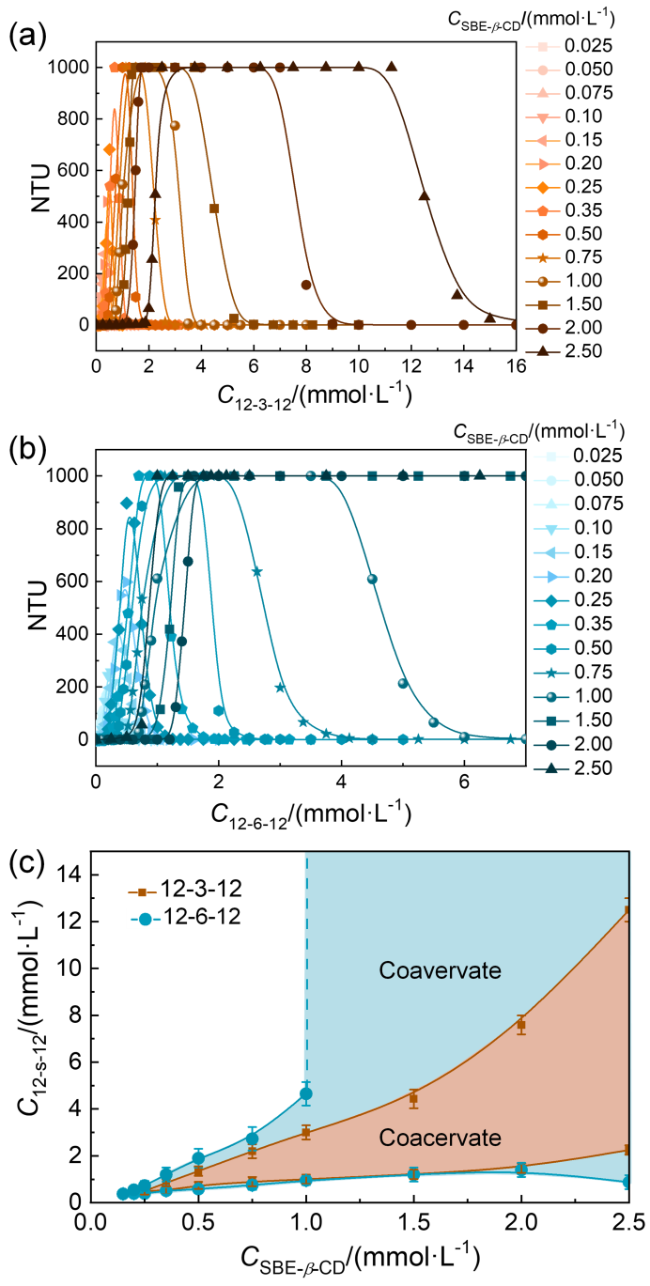
图3 固定SBE-β-CD浓度值, SBE-β-CD/12-6-12 (a)以及SBE-β-CD/ 12-3-12 (b)复合体系浊度随阳离子双子表面活性剂浓度的变化曲线. (c) SBE-β-CD/阳离子双子表面活性剂混合体系形成液液凝聚相的浓度区间Figure 3 Turbidity curves of SBE-β-CD/12-6-12 (a) and SBE-β-CD/ 12-3-12 (b) systems as a function of gemini surfactant concentrations, with fixed SBE-β-CD concentrations. (c) Concentration range for coacervate formation in SBE-β-CD/gemini surfactant mixed systems |
2.2 SBE-β-CD/12-6-12混合体系的聚集行为及分子间相互作用
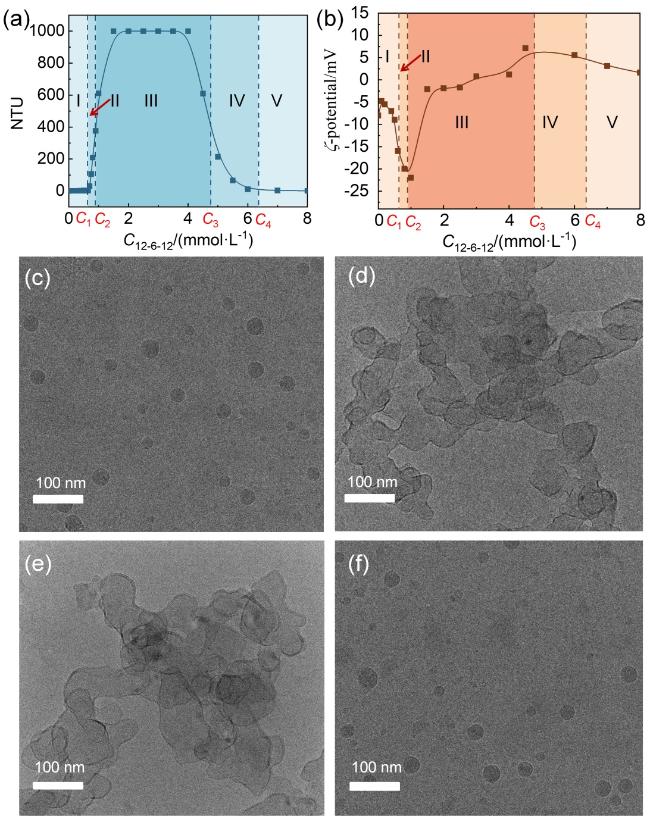
图4 固定SBE-β-CD浓度为1.00 mmol•L−1, SBE-β-CD/12-6-12体系的浊度(a)以及聚集体ζ-电位(b)随12-6-12浓度的变化曲线. 1.00 mmol•L−1 SBE-β-CD分别与以下浓度12-6-12混合后聚集体的Cryo-TEM照片: 0.25 mmol•L−1 (c); 0.70 mmol•L−1 (d); 5.00 mmol•L−1 (e); 7.50 mmol•L−1 (f)Figure 4 Turbidity (a) and ζ-potential (b) variation curves of the SBE-β-CD/12-6-12 system as a function of 12-6-12 concentration, with the SBE-β-CD concentration fixed at 1.00 mmol•L−1. Cryo-TEM images of the aggregates formed by mixing 1.00 mmol•L−1 SBE-β-CD with 12-6-12 at concentrations of 0.25 mmol•L−1 (c), 0.70 mmol•L−1 (d), 5.00 mmol•L−1 (e) and 7.50 mmol•L−1 (f) |
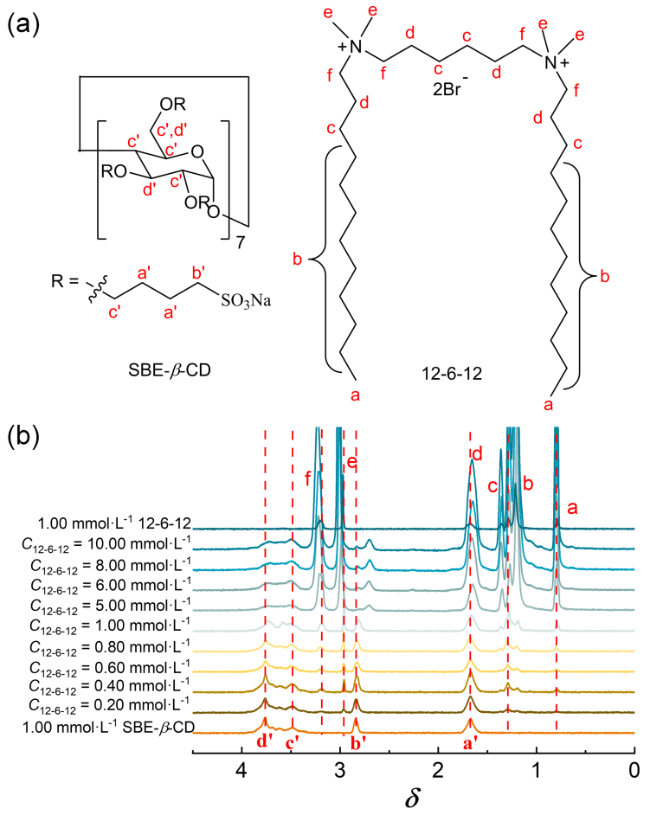
图5 (a) SBE-β-CD和12-6-12分子结构及质子归属; (b) SBE-β-CD浓度固定为1.00 mmol•L−1时, 混合体系在不同12-6-12浓度条件下的核磁谱图, 以及浓度均为1.00 mmol•L−1的纯SBE-β-CD和纯12-6-12的核磁谱图Figure 5 (a) Molecular structures and proton assignments of SBE-β-CD and 12-6-12; (b) NMR spectra of the mixed system at different 12-6-12 concentrations with the SBE-β-CD concentration fixed at 1.00 mmol•L−1, along with the NMR spectra of SBE-β-CD and 12-6-12 at a concentration of 1.00 mmol•L−1 |
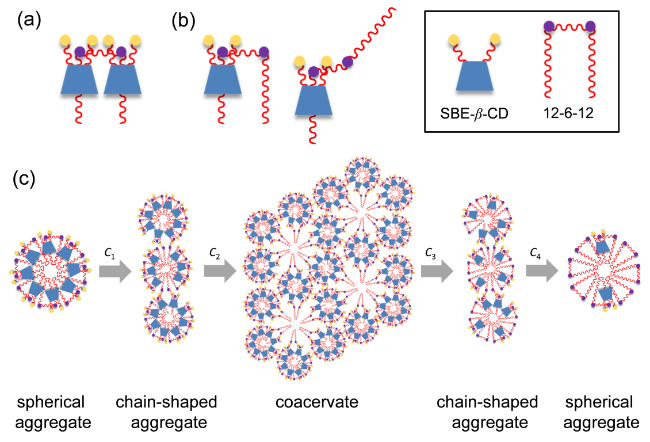
图6 (a)当12-6-12浓度低于C1时, 其与SBE-β-CD形成的复合物示意图; (b)当12-6-12浓度高于C1时, 其与SBE-β-CD形成的复合物示意图; (c) SBE-β-CD/12-6-12混合体系聚集体转变过程示意图Figure 6 (a) Schematic illustration of the complexes formed between 12-6-12 and SBE-β-CD when the 12-6-12 concentration is below C1; (b) Schematic illustration of the complexes formed when the 12-6-12 concentration is above C1; (c) Schematic representation of the aggregation transition process in the SBE-β-CD/12-6-12 mixed system |
2.3 液液相分离体系对水中有机染料的富集分离效果
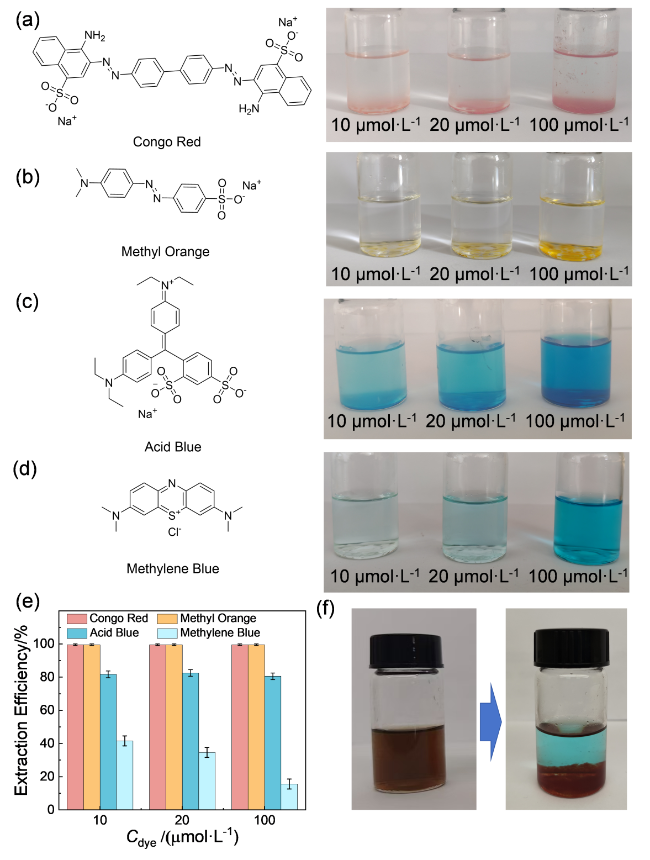
图7 四种不同染料的分子结构及液液相分离体系对不同浓度特定染料的富集提取效果照片: (a)刚果红; (b)甲基橙; (c)酸性蓝; (d)亚甲基蓝. (e)随染料浓度变化, 液液相分离体系对染料的富集提取效率. (f)液液相分离体系对刚果红和亚甲基蓝混合溶液的选择性分离效果照片Figure 7 Molecular structures of different dyes and photographs showing the enrichment and extraction performance of the coacervate for the dyes: (a) Congo red, (b) Methyl orange, (c) Acid blue, (d) Methylene blue. (e) Enrichment and extraction efficiency of the coacervate for four dyes at different concentrations. (f) Photograph of the selective separation performance of the coacervate for a mixed solution of congo red and methylene blue |