


1 引言
2 结果与讨论
2.1 物相及结构分析
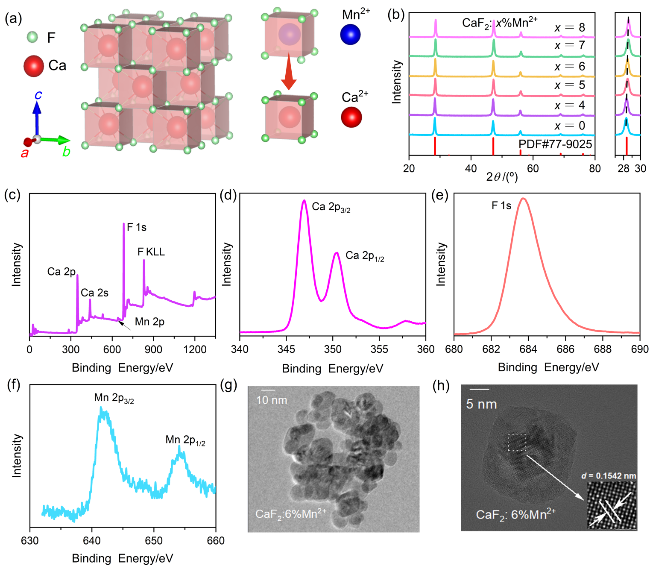
图1 (a) CaF2晶体结构; (b) CaF2:x%Mn2+ (x=0, 4, 5, 6, 7, 8)样品的XRD图及在27.5°~30°的局部放大图; (c) CaF2:6%Mn2+纳米颗粒的XPS全谱和(d) Ca、(e) F、(f) Mn的高分辨率谱; (g, h) CaF2:6%Mn2+纳米颗粒的TEM图Figure 1 (a) The crystal structure of CaF2. (b) XRD patterns of CaF2:x%Mn2+ (x=0, 4, 5, 6, 7, 8) samples and the enlarged patterns in the region of 27.5°~30°. (c) Full XPS spectrum of CaF2:6%Mn2+ nanoparticles and high-resolution XPS spectrum of (d) Ca, (e) F and (f) Mn. (g, h) TEM images of CaF2:6%Mn2+ nanoparticles |
2.2 发光特性
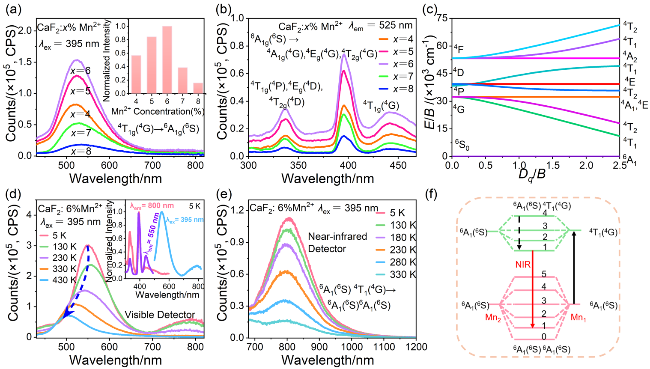
图2 室温下CaF2:x%Mn2+ (x=4, 5, 6, 7, 8)纳米颗粒的(a) PL光谱(λex=395 nm)和(b) PLE光谱(λem=525 nm). (a)中插图为Mn2+浓度与525 nm处发射峰归一化强度的关系图; (c) Mn2+离子的田边-菅野能级图(E为能级能量, B为拉卡参数, Dq为晶体场强度); (d)可见和(e)近红外检测器测得的CaF2:6%Mn2+纳米颗粒PL光谱. (d)中插图为5 K时, 该纳米颗粒的归一化PLE (λem=550 nm, λem=800 nm)和PL (λex=395 nm)光谱; (f) Mn2+-Mn2+二聚体发光机理图Figure 2 (a) PL spectra (λex=395 nm) and (b) PLE spectra (λem=525 nm) of CaF2:x%Mn2+ (x=4, 5, 6, 7, 8) nanoparticles at room temperature. The inset in Figure 2(a) shows the relationship between Mn2+ concentration and emission peak normalized intensity at 525 nm. (c) Tanabe-Sugano energy level diagram of Mn2+ ion (E is the energy of the energy levels, B is the Racah parameter, and Dq is the crystal field strength). The PL spectra of CaF2:6%Mn2+ nanoparticles obtained (d) via the visible detector and (e) the near-infrared detector. Figure 2(d) inset shows the normalized PLE (λem=550 nm, λem=800 nm) and PL (λex=395 nm) spectra of the nanoparticles at 5 K. (f) Luminescence mechanism diagram of Mn2+-Mn2+ dimer |
2.3 温度传感特性
2.3.1 基于发光强度和谱带位移的温度传感特性
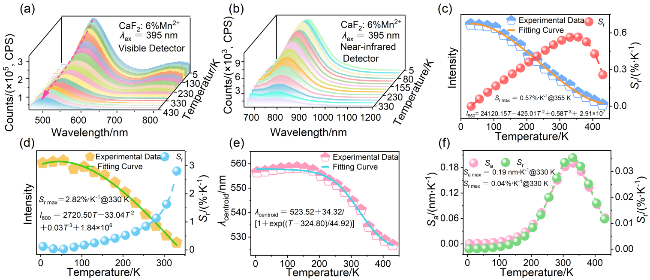
图3 CaF2:6%Mn2+纳米颗粒(a) Mn2+离子的PL光谱(λex=395 nm, 5~430 K)和(b) Mn2+-Mn2+二聚体PL光谱(λex=395 nm, 5~330 K); (c) Mn2+离子发光强度与温度的依赖性及相应测温模式下的Sr; (d) Mn2+-Mn2+二聚体发光强度的温度依赖性及相应的Sr; (e) Mn2+离子发射带质心与温度的关系及(f)对应的灵敏度Figure 3 (a) PL spectra of Mn2+ ions (λex=395 nm, 5~430 K) and (b) Mn2+-Mn2+ dimers (λex=395 nm, 5~330 K) of CaF2:6%Mn2+ nanoparticles. (c) Dependence of luminescence intensity of Mn2+ ions on temperature and corresponding Sr. (d) Temperature dependence of the integrated emission intensity of Mn2+-Mn2+ dimers and Sr. (e) Centroid of the emission band of Mn2+ ions as a function of temperature and (f) corresponding sensitivities |
2.3.2 基于LIR的温度传感特性
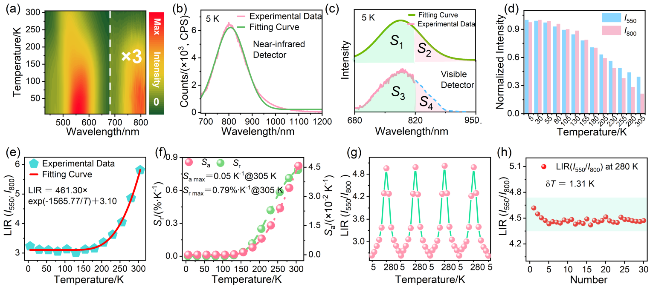
图4 (a) CaF2:6%Mn2+纳米颗粒的二维PL等高线图(λex=395 nm, 5~305 K); (b) 5 K时的近红外PL光谱及其高斯拟合曲线; (c)获取Mn2+-Mn2+二聚体发射积分强度的方法示意图; (d)不同温度下, Mn2+离子与Mn2+-Mn2+二聚体的归一化发射强度直方图; (e) LIR(I550/I800)的温度依赖性及(f)对应的灵敏度; (g)在5~280 K之间经4次加热-冷却循环测量的LIR(I550/I800)值; (h) 280 K下测量30次PL光谱, LIR(I550/I800)值对应的波动情况及计算的δT值Figure 4 (a) 2D PL contour map of CaF2:6%Mn2+ nanoparticles (λex=395 nm, 5~305 K). (b) Near-infrared PL spectrum at 5 K and its Gaussian fitting curve. (c) Diagram illustrating the methodology for determining the integrated emission intensity of Mn2+-Mn2+dimers. (d) Histograms of normalized emission intensity of Mn2+ ions and Mn2+-Mn2+ dimers at different temperatures. (e) Temperature-dependent LIR(I550/I800) values and (f) the corresponding sensitivities. (g) LIR(I550/I800) values measured by 4 heating-cooling cycles between 5~280 K. (h) The corresponding fluctuation of LIR(I550/I800) value obtained from PL spectra measured 30 times at 280 K and calculated δT value |
2.3.3 基于寿命的温度传感特性
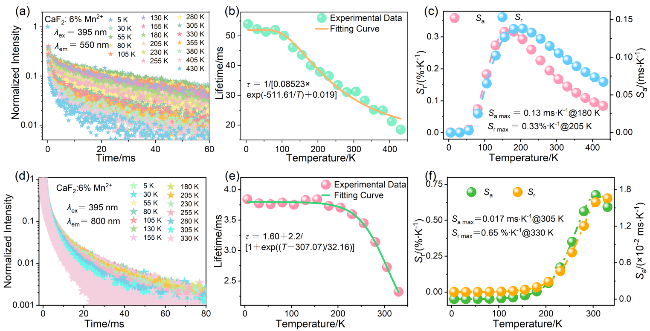
图5 CaF2:6%Mn2+纳米颗粒的(a) Mn2+离子荧光衰减曲线(λex=395 nm, λem=550 nm, 5~430 K)和(d) Mn2+-Mn2+二聚体荧光衰减曲线(λex=395 nm, λem=800 nm, 5~330 K); (b) Mn2+离子荧光寿命和(e) Mn2+-Mn2+二聚体荧光寿命与温度的依赖性; (c) Mn2+离子荧光寿命和(f) Mn2+-Mn2+二聚体荧光寿命测温模式下, 不同温度下的Sa和SrFigure 5 (a) Mn2+ ion luminescent decay curves (λex=395 nm, λem=550 nm, 5~430 K) and (d) Mn2+-Mn2+ dimer luminescent decay curves (λex=395 nm, λem=800 nm, 5~330 K) of CaF2:6%Mn2+ nanoparticles; Temperature-dependent of (b) Mn2+ ion luminescent lifetime and (e) Mn2+-Mn2+ dimer luminescent lifetime; Sa and Sr for (c) Mn2+ ion luminescent lifetime and (f) Mn2+-Mn2+ dimer luminescent lifetime thermometry mode at various temperatures |