1 引言
2 结果与讨论
2.1 晶体结构
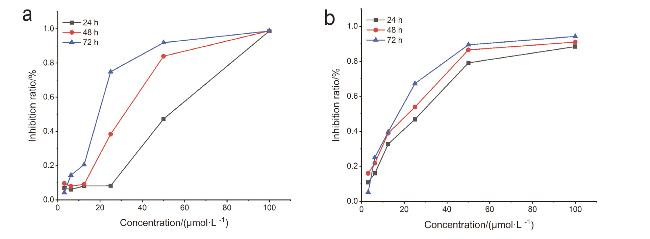
2.2 MTT实验
表1 化合物作用测试细胞系48 h的IC50值Table 1 IC50 values of the compounds against the tested cell lines for 48 h |
| Compound | IC50 a/(μmol•L−1) | ||||
|---|---|---|---|---|---|
| HeLa | NCI-H460 | BGC-823 | HepG-2 | HUVEC | |
| Oxaliplatin | 48.48±0.22 | 35.10±0.74 | 9.16±0.19 | 12.21±3.17 | 10.64±3.68 |
| 1 | 29.96±3.11 | 28.88±4.49 | 26.34±4.54 | 28.72±1.98 | 23.15±2.09 |
| 2 | 22.36±3.96 | 31.26±0.78 | 19.20±2.47 | 13.59±1.00 | 20.08±1.45 |
| 3 | 48.88±1.12 | 44.43±2.41 | 44.83±2.12 | 30.54±1.24 | 72.436 |
| L1 | >100 | >100 | >100 | >100 | — |
| L2 | >100 | >100 | >100 | >100 | — |
| CuBr2 | 161.5 | 106.0 | 84.7 | 117.7 | — |
| CuCl2 | 142.0 | 106.8 | 88.9 | 102.3 | — |
a Oxaliplatin was used as a positive control. Data are presented as half maximal inhibitory concentration (IC50) value and 95% confidence intervals (CI 95%) from three independent experiments performed in triplicate. Malignant cell line: HeLa, NCI-H460, BGC-823, HepG-2. Non-malignant cell line: HUVEC. |
2.3 溶解性和稳定性
2.4 Hoechst 33342染色实验
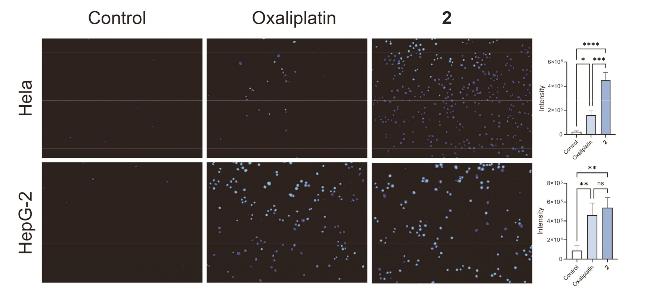
图3 Hoechst 33342染色检测配合物2 (20 μmol/L)对HeLa和HepG-2细胞形态24 h的影响以及相对荧光强度的光密度值(10×10). 注: 数据表示为三组独立实验的平均值±标准差. *p<0.05, **p<0.01, ***p<0.001, ****p<0.0001, ns=非显著性差异(non-significant)Figure 3 Hoechst 33342 staining to detect the effect of complex 2 (20 μmol/L) on the morphology of HeLa and HepG-2 cells for 24 h and the optical density value of the relative fluorescence intensity (10×10). Note: Data are expressed as mean ± standard deviation of three independent experiments. *p<0.05, **p<0.01, ***p<0.001, ****p<0.0001, ns=non-significant |
2.5 细胞内ROS的产生
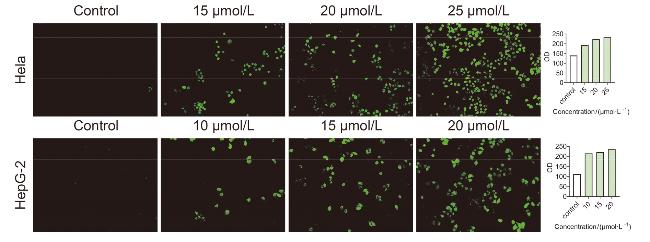
2.6 线粒体膜电位
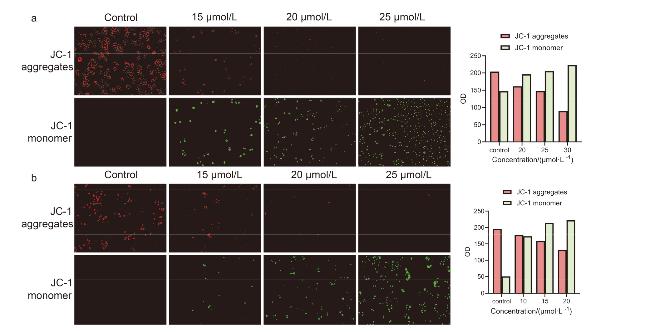
图5 JC-1测定配合物2对HeLa、HepG-2细胞线粒体膜电位24 h的影响, 及相对荧光强度的光密度值(10×10) (a: HeLa细胞, b: HepG-2细胞)Figure 5 The effect of complex 2 on mitochondrial membrane potentials of HeLa, HepG-2 cells for 24 h were determined with JC-1 and the optical density value of the relative fluorescence intensity (10×10) (a: HeLa cells, b: HepG-2 cells) |
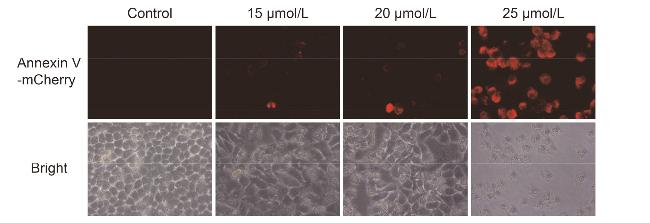
2.7 Annexin V-mCherry细胞凋亡
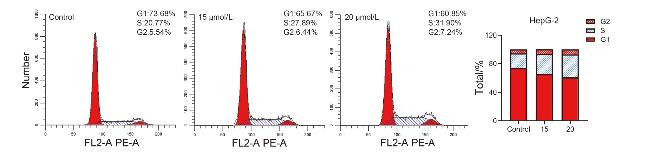
2.8 细胞周期阻滞分析
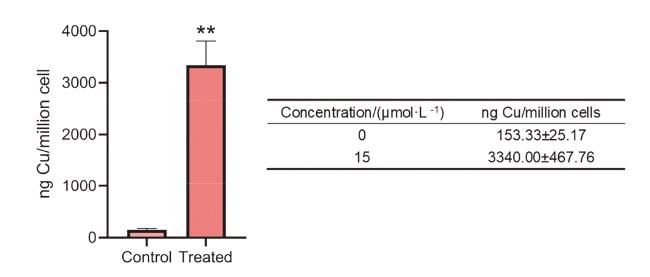
2.9 细胞摄取
2.10 迁移和侵袭
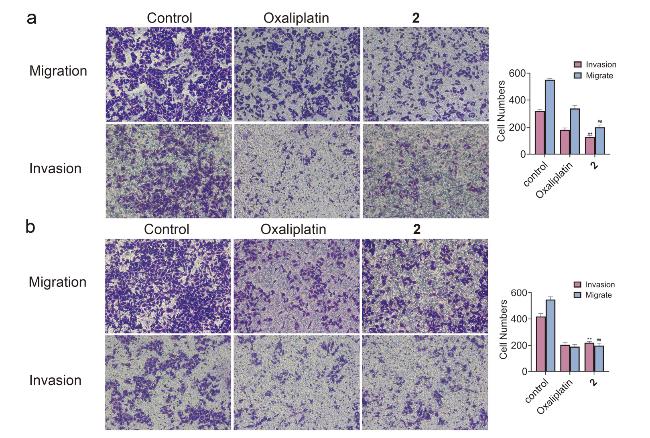
图9 配合物2对HeLa和HepG-2细胞迁移和侵袭的影响以及通过腔室的细胞数量(10×10). 注: 数据表示为三组独立实验的平均值±标准差. **p<0.01, ##p<0.01 (a: HeLa细胞, 20 μmol/L Oxaliplatin, 20 μmol/L 2; b: HepG-2细胞, 15 μmol/L Oxaliplatin, 15 μmol/L 2)Figure 9 The effect of complex 2 on HeLa and HepG-2 cells migration and invasion and the number of cells passing through the chamber (10×10). Note: The data is represented as mean ± standard deviation of three independent experiments. **p<0.01, ##p<0.01 (a: HeLa cells, 20 μmol/L Oxaliplatin, 20 μmol/L 2; b: HepG-2 cells, 15 μmol/L Oxaliplatin, 15 μmol/L 2) |
2.11 体外血管生成
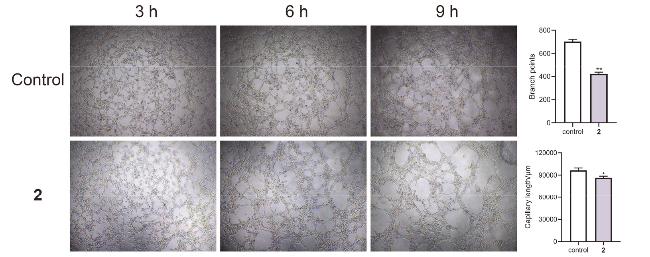
图10 配合物2 (20 μmol/L)对HUVEC细胞血管生成的影响(10×4), 血管分支数量和血管总长度的统计. 注: 数据表示为三组独立实验的平均值±标准差. *p<0.05, **p<0.01Figure 10 The effect of complex 2 (20 μmol/L) on the angiogenesis of HUVEC cells and the number of vascular branches and the total length of vessels (10×4). Note: Data are expressed as mean ± standard deviation of three independent experiments. *p<0.05, **p<0.01 |