


1 引言
2 模型与方法
2.1 数据库
2.2 分子动力学模拟和特征描述符
2.2.1 分子动力学模拟
2.2.2 描述符
表1 描述符及其缩写和单位列表Table 1 List of descriptors, their abbreviations, and units |
| Descriptors | Abbreviations | Units |
|---|---|---|
| Largest Cavity Diameter | LCD | nm |
| Pore Limiting Diameter | PLD | nm |
| Largest Free Path Diameter | LFPD | nm |
| Framework Density | ρ | g•cm−3 |
| Unit Cell Volume | PV(1) | nm3 |
| Porosity | PV(2) | — |
| Pore Volume per Unit Mass | PV(3) | cm3•g−1 |
| Kinetic Diameter | Dia | nm |
| Polarizability | Pol | nm3 |
| Quadrupole Moment | Qua | C•m2 |
| Dipole Moment | Dip | D |
2.3 机器学习与迁移学习
3 结果与讨论
3.1 构效关系
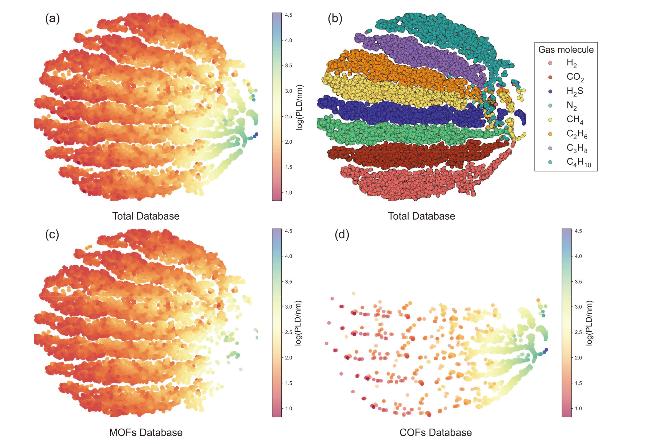
图2 数据集的t-SNE分布图(a)~(d)依次分别为总数据集、总数据集以气体区分, MOFs数据集、COFs数据集的t-SNE分布图, 其中(a)、(c)和(d)以log(PLD)着色 Figure 2 t-SNE Distribution of MOF and COF Datasets t-SNE distribution plots of datasets, Panels (a)~(d) correspond to the entire dataset, the entire dataset divided by gas molecule, the MOFs dataset, and the COFs dataset, which (a), (c), and (d) are colored by the log(PLD), respectively |
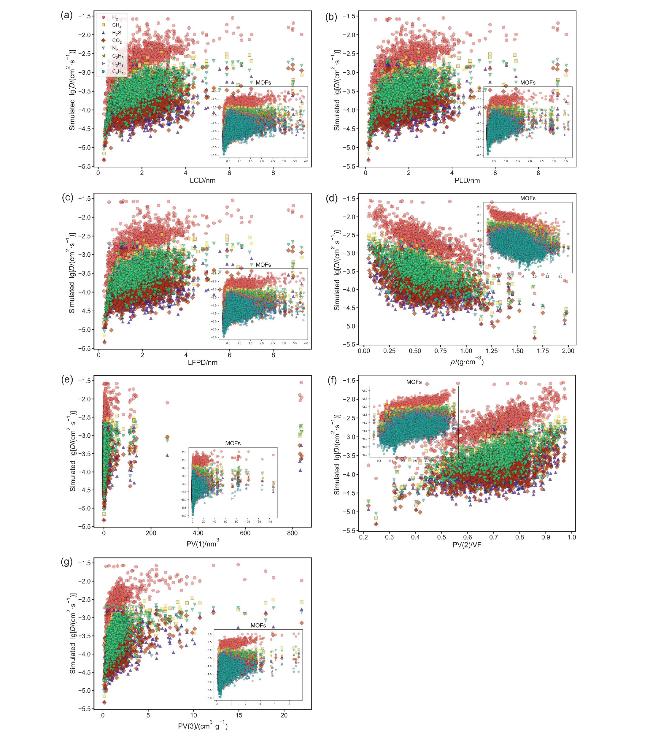
图3 几何描述符与自扩散系数的构效关系(a)~(g)依次分别为LCD、PLD、LFPD、ρ、PV(1)、PV(2)、PV(3)与各类气体分子自扩散系数对数值的散点图, 其中主图中的是COFs, 小图中的是MOFs, 气体分子的种类由散点的形状和颜色区分 Figure 3 Structure-property relationships of geometric descriptors and self-diffusion coefficients The scatter plots illustrate the relationships between geometric descriptors and the logarithmic self-diffusion coefficient (lgD) of gas molecules in frameworks. Panels (a)~(g) correspond to the largest cavity diameter (LCD), pore limiting diameter (PLD), largest free path diameter (LFPD), framework density (ρ), unitcell volume, void fraction, and unit mass pore volume (PV(1), PV(2), PV(3)), respectively. Main plots represent COFs, with insets showing MOFs. Gas molecule types are distinguished by scatter point shapes and colors |
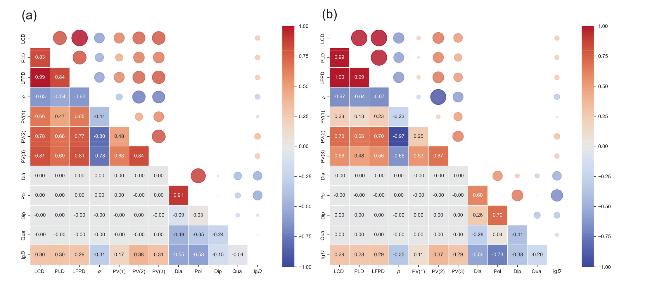
图4 描述符的Pearson相关系数热图描述符与自扩散系数之间的Pearson相关系数热图, (a)对应MOFs数据集, (b)对应COFs数据集 Figure 4 Pearson correlation heatmap of descriptors Heatmap of Pearson correlation coefficients between descriptors and the self-diffusion coefficient. Panel (a) corresponds to the MOFs dataset, and panel (b) corresponds to the COFs dataset |
3.2 预训练
表2 MOFs预训练与COFs直接泛化预测结果Table 2 MOFs pretraining and COFs direct generalization prediction results |
| Model | MOFs | COFs | |||||
|---|---|---|---|---|---|---|---|
| R2 | SRCC | MSE | R2 | SRCC | MSE | ||
| RF | 0.806 | 0.855 | 0.051 | 0.716 | 0.805 | 0.091 | |
| XGBR | 0.813 | 0.862 | 0.049 | 0.666 | 0.785 | 0.108 | |
| LGBM | 0.817 | 0.863 | 0.048 | 0.683 | 0.792 | 0.102 | |
| DNN | 0.792 | 0.841 | 0.054 | 0.669 | 0.786 | 0.107 | |
3.3 迁移学习
表3 COFs直接学习与迁移学习结果Table 3 COFs direct learning and transfer learning results |
| Learning Way | Model | COFs | ||
|---|---|---|---|---|
| R2 | SRCC | MSE | ||
| Direct Learning | RF | 0.809 | 0.852 | 0.063 |
| XGBR | 0.826 | 0.866 | 0.057 | |
| LGBM | 0.827 | 0.866 | 0.057 | |
| DNN | 0.781 | 0.841 | 0.072 | |
| Transfer Learning | RF | 0.775 | 0.822 | 0.071 |
| XGBR | 0.791 | 0.833 | 0.068 | |
| LGBM | 0.803 | 0.842 | 0.064 | |
| DNN_1 | 0.771 | 0.826 | 0.074 | |
| DNN_2 | 0.753 | 0.819 | 0.080 | |
| DNN_3 | 0.760 | 0.830 | 0.078 | |
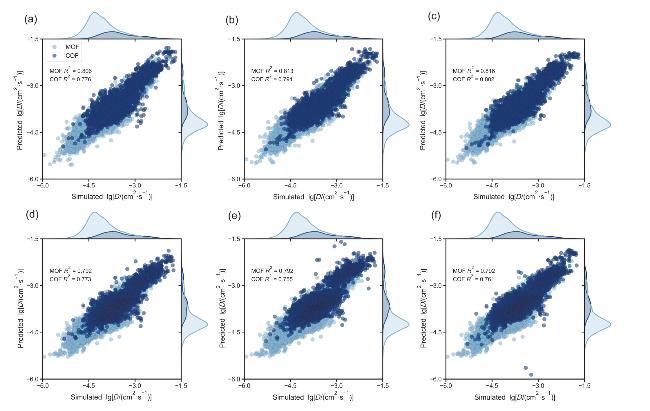
图5 自扩散系数预测值与模拟值的比较各模型的自扩散系数预测值与模拟值之间的散点图, (a)~(f)依次对应RF、XGBR、LGBM、DNN_1、DNN_2和DNN_3 Figure 5 Comparison of predicted and simulated self-diffusion coefficients Scatter plots of predicted versus simulated self-diffusion coefficients (D) for different models. Panels (a)~(f) correspond to Random Forest (RF), Extreme Gradient Boosting Regression (XGBR), Light Gradient Boosting Machine (LGBM), and three Deep Neural Network models (DNN_1, DNN_2, DNN_3), respectively |
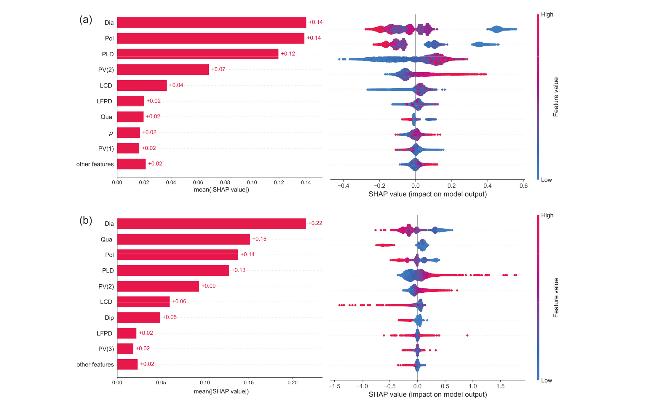
图6 模型的SHAP值解释图(a)对应LGBM, (b)对应DNN_1, 其各自的左图为SHAP值重要性, 右图为特征密度散点图 Figure 6 SHAP value interpretation of model SHAP value interpretation plots for different models. Panel (a) corresponds to Light Gradient Boosting Machine (LGBM), and panel (b) corresponds to Deep Neural Network (DNN_1). The left plot in each panel shows SHAP value importance, and the right plot shows the feature density scatter plot |
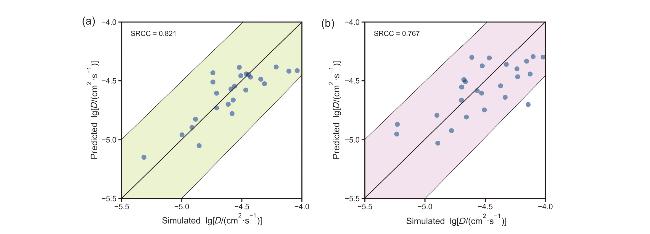


图7 (a)迁移学习LGBM模型预测C2H6、C3H8、C4H10三类气体在30种COF结构中的自扩散系数; (b)迁移学习DNN_1模型预测C2H6、C3H8、C4H10三类气体在30种COF结构中的自扩散系数Figure 7 (a) The transfer learning-based LGBM model predicts the self-diffusion of C2H6, C3H8, and C4H10 among 30 COF structures. (b) The transfer learning-based DNN_1 model predicts the self-diffusion of C2H6, C3H8, and C4H10 among 30 COF structures |