


1 Introduction
The global pursuit of carbon neutrality has spurred significant interest in solar-driven photocatalytic CO2 reduction for producing sustainable value-added chemicals.[1] However, this process faces persistent challenges, primarily due to the inherent thermodynamic stability of CO2 (C=O bond dissociation energy ≈750 kJ/mol) and the complex multi-electron/proton transfer pathways that lead to diverse reduction products such as CO, CH4, C2H4 and CH3OH.[2-3] These challenges underscore the need for advanced photocatalysts that simultaneously achieve high activity, selectivity, and stability to suppress competing side reactions.[4]
Metal-organic frameworks (MOFs) have gained prominence as promising platforms for CO2 photoreduction, owing to their tunable structures, high surface areas, and well-defined active sites.[5-8] The periodic arrangement of metal nodes and organic linkers in MOFs allows for atomic-level dispersion of catalytic sites, while their hierarchical pore structure promotes mass transport and confines reactive intermediates. The nanoconfinement effect afforded by tailored MOF pores effectively suppresses nanoparticle aggregation throughout catalytic cycles, thereby improving long-term stability.[9-14] Recent breakthroughs highlight the effectiveness of MOF-based confinement strategies. Zhang et al.[15] demonstrated the in situ synthesis of ultrafine BiVO4 nanoclusters (1.5~3.0 nm) within MIL frameworks via polyoxometalate templating, achieving exceptional dispersion of active sites. Liu et al.[16] demonstrated that spatially confining Au nanorods within PCN-222 frameworks significantly enhances the selectivity for CH4 production, with the protonation dynamics playing a critical governing role. These works demonstrate how MOF architectures can facilitate charge carrier dynamics and stabilize intermediates, providing promising pathways for efficient CO2 photoreduction.
PCN-250, a robust MOF assembled from Fe3-μ3-oxo clusters and azobenzene tetracarboxylate (ABTC) linkers, exhibits exceptional aqueous stability over a broad pH range. Coupled with its superior light-harvesting properties and cost-effectiveness, PCN-250 has emerged as a promising photocatalyst for CO2 reduction.[17] Meanwhile, WO3 serves as an efficient water oxidation cocatalyst, generating H+ protons to sustain photocatalytic CO2 conversion. However, conventional synthetic routes for WO3 typically produce lamellar aggregates or polydisperse nanoparticles (50~300 nm). These morphologies often exhibit restricted interlayer charge transport and a limited availability of exposed active sites, which ultimately constrain their photocatalytic efficiency.[18-19]
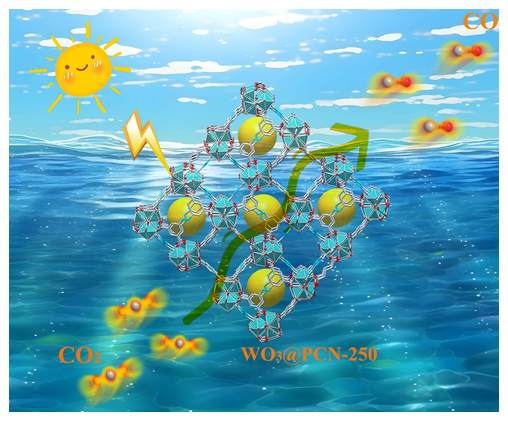
To overcome these challenges, a series of WO3@PCN- 250-x composites were fabricated through the in situ confinement of ultrasmall WO3 nanoclusters within the porous matrix of PCN-250. The optimized catalyst, denoted as W@P-2, delivered a notable CO production rate of 516.07 μmol•g-1 under visible-light irradiation, exceeding those of conventional WO3-based photocatalysts. Systematic mechanistic studies revealed that the encapsulated WO3 nanoclusters act synergistically by increasing the accessibility of active sites and establishing a direct Z-scheme charge transfer pathway across the WO3/PCN-250 interface. In contrast to conventional WO3/MOF physical mixtures or surface-loaded composites, which often suffer from interfacial charge recombination, the in situ confinement strategy yields an intimately integrated Z-scheme heterojunction that preserves the strong redox capabilities of both components. Meanwhile, the confinement effect of PCN-250 effectively suppresses the aggregation of WO3 nanoparticles, overcoming the longstanding limitation of interlayer charge transport observed in conventional WO3 morphologies and substantially improving the overall photocatalytic efficiency.
2 Result and Discussion
2.1 Synthesis and Characterization
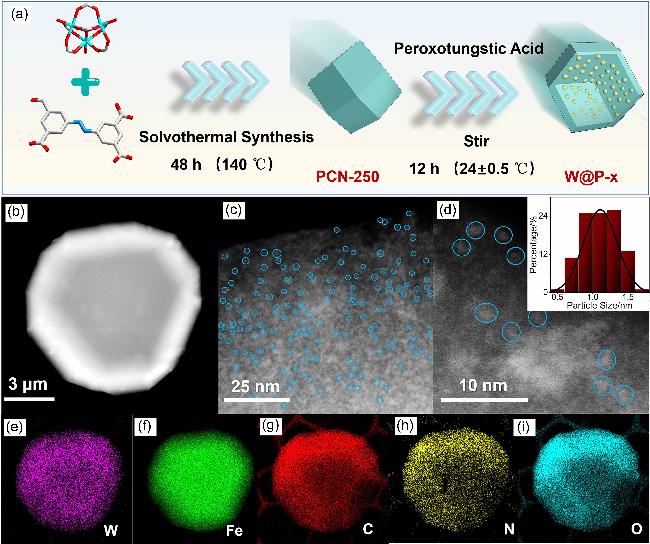
The precursor of peroxotungstic acid was prepared by the sol-gel method.[18] According to the literature method, PCN-250 crystal can be easily prepared by solvothermal method with 3,3',5,5'-azobenzenetetracarboxylate (H4ABTC) as an organic linker and Fe3-μ3-oxo as a metal cluster.[15] Taking PCN-250 as a platform, ultra-small WO3 nanoclusters were encapsulated to construct a W@P-x Z-type heterojunction composite photocatalyst (Figure 1, and Supporting Information (SI) Figure S1). A series of W@P-x were synthesized, the addition of peroxotungstic acid and PCN-250 are summarized in Table S1 (SI). Scanning electron microscopy (SEM; Figure S2) image reveals that the pristine PCN-250 exhibits a well-defined octahedral morphology with an average size of 8.0 µm.[16] The high-resolution transmission electron microscopy image (HRTEM; Figure 1b) reveals an octahedral morphology with smooth surfaces, suggesting minimal WO3 recrystallization on the PCN-250 surface. High-angle annular dark field scanning transmission electron microscopy (HAADF-STEM) characterization confirms the successful confinement and encapsulation of WO3 nanoclusters within the PCN-250 (Figures 1c and 1d). In W@P-2 composites, WO3 nanoclusters with diameters ranging from 0.8 to 1.4 nm are uniformly distributed in PCN-250. Applying the same synthetic approach to a porous carbon support results in the formation of W@C composites, wherein smaller WO3 nanoclusters with an average diameter of ≈0.6 nm are uniformly dispersed (Figure S3). The elemental mapping of W@P-2 demonstrates that Fe, W, C, N and O elements are uniformly dispersed in the composite catalyst (Figures 1e~1i). These findings validate the efficacy of the proposed synthesis strategy for encapsulating ultrasmall WO3 nanoclusters within the porous architecture of PCN-250.[20-21]
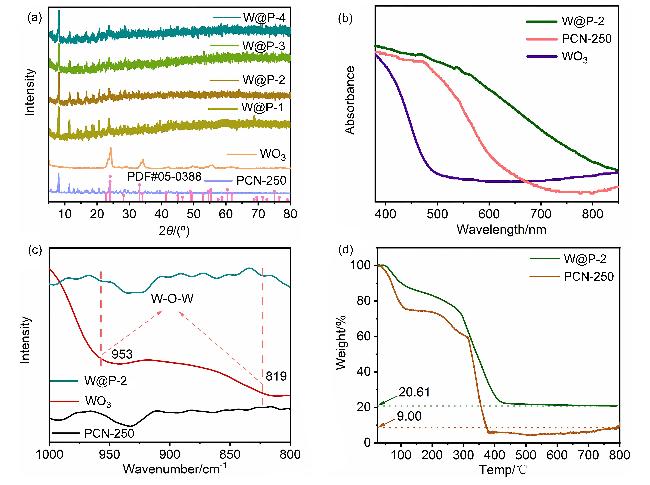
Powder X-ray diffraction (PXRD) patterns of the as-prepared W@P-x samples (Figures 2a and S4) show excellent agreement with the simulated pattern. The PXRD pattern of W@P-2 exhibits only PCN-250 characteristic diffraction peaks,[21-22] indicating homogeneous dispersion of WO3 within the PCN-250. The remarkable stability of WO3 nanoclusters in acidic media motivated the use of aqua regia treatment on W@P-2 to isolate the crystalline WO3 nanoclusters. As revealed in Figure S5, three peaks at 16.5°, 25.6° and 34.1° are attributable to the (020), (111), and (200) reflections of WO3•H2O, respectively, demonstrating the presence of WO3•H2O in W@P-2. Additionally, the PXRD pattern of W/P-2 exhibits distinct peaks at 22.9° and 24.1°, which can be indexed to the (001) and (200) planes of WO3, respectively, confirming the presence of its characteristic crystal structure (Figure S4).[23] PXRD analysis confirms the uniform dispersion of WO3 nanoclusters within the pores of PCN-250.[20]
The optical absorption properties of W@P-2 were characterized by ultraviolet-visible (UV-vis) absorption spectroscopy. Figures 2b and S6 reveal that the UV-vis absorption edge of W@P-2 extends to 800 nm, almost covering the entire visible light region. As shown in Figures 2c and S7, the fourier transform infrared (FTIR) spectra of W@P-2, W/P-2, PCN-250 and WO3 revealed characteristic W-O-W stretching vibrations at 953 and 819 cm-1.[17,21] The W-O-W stretching vibration in W@P-2 exhibits a blueshift to higher wavenumbers. This spectral change is attributed to modifications in the bond vibrational mode induced by electronic interactions, suggesting a close association between the PCN-250 framework and the WO3 nanoclusters. Thermogravimetric analysis (TGA) performed in air revealed distinct thermal decomposition profiles for W@P-2 and pristine PCN-250 (Figure 2d), which conclusively indicates the successful incorporation of WO3.[15]
To elucidate the structural and functional implications of WO3 incorporation, comprehensive characterizations were conducted. N2 and CO2 sorption measurements were performed on PCN-250, WO3, and the composite W@P-2 to characterize their respective porous structures and to evaluate the CO2 adsorption capacity of W@P-2. The N2 adsorption-desorption isotherm of W@P-2 was measured at 77 K, yielding a BET surface area of 564.99 m2•g-1 (Figure S8). Relative to pristine PCN-250 (1190.72 m2•g-1), W@P-2 exhibits a reduced specific surface area and an increased average pore size, from 0.78 nm (PCN-250) to 0.84 nm (W@P-2) (Figure S9). The experimental results confirm that W@P-2 retains a porous structure, with the pores of PCN-250 being occupied by ultrasmall WO3 nanoclusters. The CO2 adsorption capacities of WO3, pristine PCN-250, and the W@P-2 composite were determined to be 3.45, 63.03, and 42.49 cm3•g-1, respectively, at 298 K and 101 kPa (Figure S10). This result indicates that the high CO2 adsorption capacity of W@P-2 facilitates transfer of CO2 molecules to its active surface, which is conducive to subsequent catalytic processes.[20]
The enhanced photoelectrochemical properties of W@P-2 were systematically verified. Steady-state photoluminescence (PL) spectra showed significant quenching upon WO3 integration (Figure S11), suggesting inhibited charge recombination. Measured by time-resolved photoluminescence spectroscopy (Figure S12), the decay lifetime of W@P-2 is 5.23 ns, markedly longer than that of pristine PCN-250 (0.70 ns), indicating more efficient suppression of charge recombination. Consistent with the enhanced charge separation, W@P-2 exhibits a significantly higher photocurrent density than PCN-250 and WO3 (Figure S13), alongside a smaller semicircle radius in its Nyquist plot (Figure S14), which collectively indicates a lower charge-transfer resistance and more efficient charge migration. Collectively, these results affirm that the synergistic integration of PCN-250 and WO3 not only maintains a functional porous framework but also significantly promotes light harvesting and the separation of photogenerated charge carriers.
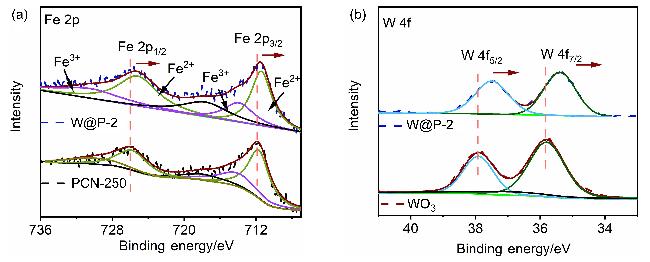
As illustrated in Figure S15, PCN-250 exhibits a band gap of 1.75 eV, whereas WO3 has a band gap of 2.42 eV. The corresponding conduction band (CB) and valence band (VB) potentials were also determined (Figures S16 and S17). Specifically, the CB and VB of PCN-250 are positioned at -0.75 V and +1.00 V (vs. NHE, pH=7.0), respectively. In comparison, WO3 shows CB and VB potentials of -0.24 V and+2.18 V, respectively.[17,23] To probe the chemical composition and interfacial electronic interactions, high-resolution X-ray photoelectron spectroscopy (XPS) was performed on WO3, PCN-250, and W@P-2. The survey spectrum of W@P-2 (Figure S18) simultaneously displays characteristic signals of Fe, C, O, N, and W, confirming the successful incorporation of WO3 into the PCN-250 framework. In the high-resolution Fe 2p spectrum (Figure 3a), characteristic doublets corresponding to Fe2+ (711.40/725.20 eV) and Fe3+ (713.90/730.40 eV) are observed, and these spectral features are preserved in the W@P-2 composite. Similarly, the high-resolution W 4f XPS spectrum of W@P-2 (Figure 3b) exhibits two characteristic peaks at 35.39 and 37.49 eV, which are assigned to W6+.[20] A slight negative shift in the binding energies of both Fe 2p and W 4f is observed. In the C 1s spectrum (Figure S19), peaks corresponding to C—C, C—N, and O—C=O are clearly identified at 284.72, 285.90, and 288.86 eV, respectively. Compared to pristine PCN-250, the N 1s and O 1s peaks in W@P-2 shift to lower binding energies (Figures S20 and S21), indicating an increased electron density within the MOF framework. Conversely, the O 1s peak of W@P-2 shows a positive shift relative to pristine WO3, suggesting a decreased electron density around WO3 after composite formation. These results collectively demonstrate an interfacial charge transfer from WO3 to PCN-250 upon integration, accompanied by the establishment of an effective heterojunction interface in the W@P-2 composite.[24]
2.2 Photocatalytic CO2 Reduction
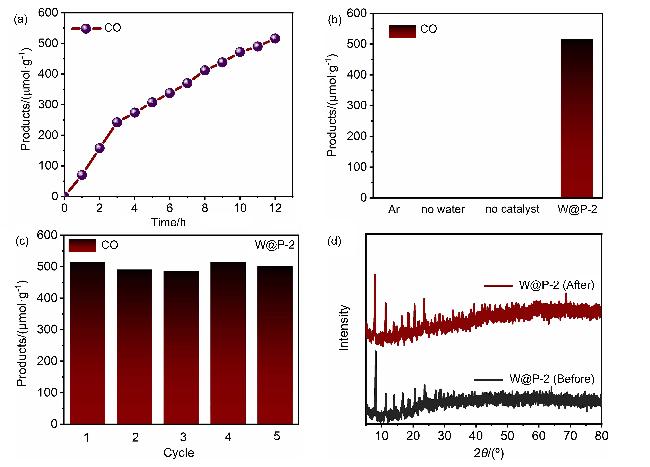
The solar-driven photocatalytic CO2 reduction was performed under ambient conditions with water vapor as the proton source. As shown in Figure S22, the pristine WO3 exhibited limited photocatalytic activity, with a CO evolution rate of 56.80 μmol•g-1. The W@P-2 heterostructure demonstrated a notable enhancement in photocatalytic performance under identical conditions, yielding 516.07 μmol•g-1 of CO following 12 h illumination (Figure 4a) with 100% selectivity toward CO2. This performance significantly exceeded that of the individual components. Control experiments identified the W@P-2 photocatalyst, incident light, and the presence of water vapor as critical factors governing the high-selectivity CO2 photoreduction process (Figure 4b). To assess catalytic stability, recycling tests were performed. As shown in Figure 4c, the CO production yield of W@P-2 exhibits no significant decay over five consecutive cycles. Post-recycling SEM and PXRD analyses further confirmed that the W@P-2 retained its original crystal structure and morphology (Figures 4d and S23). These results indicate that W@P-2 maintain the robustness comparable to the as-synthesized material. Furthermore, the composite demonstrates efficient water oxidation capability during photocatalysis. This is corrobor-ated by PL spectral analysis (Figure S24), in which the characteristic emission peak of 7-hydroxycoumarinn at 456 nm verifies the formation of •OH radicals via an •OH-mediated coumarin oxidation pathway, confirming that H2O oxidation primarily generates •OH. Collectively, the photogenerated electron-hole pairs in W@P-2 possess strong redox capacity, capable of driving both CO2 reduction and water oxidation effectively.
2.3 Photocatalytic Mechanism
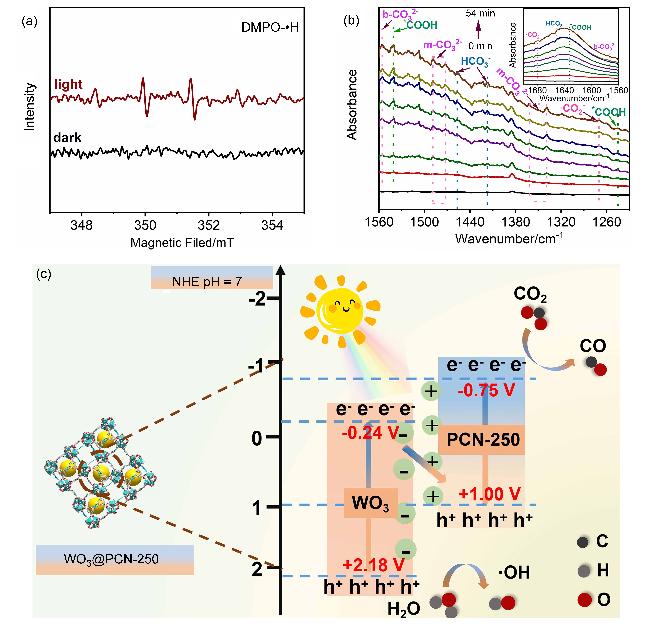
To probe the reactive intermediates generated during H2O photooxidation, electron paramagnetic resonance (EPR) spectroscopy was employed using 5,5-dimethyl-1- pyrroline N-oxide (DMPO) as a spin-trap agent. Upon light irradiation, characteristic quartet signals with a 1∶2∶2∶1 intensity ratio were observed in the EPR spectrum (Figure 5a), corresponding to DMPO-•OH adducts and thus confirming the generation of •OH radicals during H2O photooxidation catalyzed by W@P-2. Under Xe lamp irradiation, photogenerated holes in WO3 nanoclusters can oxidize H2O to •OH via the reaction: H2O→•OH+H++ e-, with a thermodynamic potential of +1.99 V (vs. NHE). Concurrently, PCN-250 harvests photons to generate electrons in its conduction band, which reduce CO2 along the pathway CO2+2H++2e-→CO+H2O (-0.74 V). The interfacial charge-transfer pathway in W@P-2 was further elucidated by in situ irradiated X-ray photoelectron spectroscopy (XPS). As shown in Figure S25, the Fe 2p binding energies shift toward lower values under illumination, suggesting an increase in electron density around the Fe centers. This is attributed to electron transfer from WO3, as further supported by corresponding shift of the W 4f peaks to higher binding energies (Figure S26), which reflects electron depletion at W sites. These opposite spectral shifts collectively confirm directional electron transfer from WO3 to PCN-250, consistent with a Z-scheme heterojunction mechanism. To dynamically monitor the evolution of key intermediates during CO2 photoreduction, in situ diffuse reflectance infrared fourier transform spectroscopy (DRIFTS) was conducted on the W@P-2 catalyst. As shown in Figure 5b, characteristic vibrational bands corresponding to adsorbed CO2 (*$CO_{2}^{}$ at 1268 and 1680 cm-1), bidentate carbonate ($b-CO_{3}^{2}$ at 1555 and 1575 cm-1), monodentate carbonate ($m-CO_{3}^{2}$ at 1495, 1473, 1361 and 1339 cm-1), and bicarbonate ($HCO_{3}^{}$ at 1651, 1457 and 1417 cm-1) exhibited progressive intensity enhancement throughout the reaction. The emergence and gradual intensification of absorption bands at 1632, 1540, and 1246 cm-1 can be unequivocally assigned to the *COOH intermediate. This species has been identified as the rate-determining intermediate for CO generation during photocatalytic CO2 reduction,[25-26] indicating that the formation of *COOH constitutes the key kinetic bottleneck in the CO production pathway. Together, these spectroscopic observations confirm the operation of a Z-scheme charge-transfer mechanism within the W@P-2 heterojunction (Figure 5c).


3 Conclusion
In summary, a highly efficient Z-scheme heterojunction photocatalyst (W@P-2) was successfully constructed by combining a molecular cavity-confinement strategy with a sol-gel method, enabling precise immobilization of ultrasmall WO3 nanoclusters within the three-dimensional porous framework of PCN-250. This unique architecture effectively suppresses WO3 aggregation, enhances mass transfer, and exposes numerous active sites. The optimized W@P-2 composite exhibits remarkable visible-light photocatalytic CO2 reduction performance, achieving a CO production rate of 516.07 μmol•g-1 with 100% selectivity, a 9.1-fold enhancement over pristine WO3. Combined in situ spectroscopic and photoelectrochemical analyses confirm that the Z-scheme charge-transfer pathway promotes efficient separation of photogenerated carriers while preserving their strong redox capabilities, thereby driving both CO2 reduction and H2O oxidation. Furthermore, the formation of the *COOH intermediate is identified as the rate-determining step in CO generation. This work not only demonstrates a viable strategy for the precise integration of metal-oxide clusters within MOF hosts, but also provides fundamental insights for designing high-performance heterojunction photocatalysts toward sustainable solar-to-fuel conversion.
4 Experimental Section
4.1 General Information
PXRD data were recorded on an X-ray powder diffractometer (Ultima IV, Rigaku, Japan). The UV-Vis absorption spectra were collected by a UV-Vis spectrophotometer (2550, Shimadzu, Japan). HRTEM images were performed on a transmission electron microscope (JEOL, JEM-2010, Japan). Gas adsorption and desorption isotherms were taken using specific surface and pore size analyzer (BELSORP-max, Microtrac BEL, Japan) and the specific surface areas were detected by the Brunauer-Emmett-Teller (BET) method. Element species and valence analysis were recorded by the XPS spectroscopy (ESCALAB250Xi, Thermo, England). The products of CO2 photoreduction were analyzed in a gas chromatograph (GC-2014, Shimadzu, Japan) equipped with TCD and FID dual detectors using argon as carrier. EPR spectroscopic measurements were performed on a Bruker EMX Plus-6/1 electron paramagnetic resonance spectrometer (Switzerland) at room temperature. DRIFTS date was performed on a Thermo Scientific Nicolet iS50 transform infrared spectrometer with an in-situ infrared cell and a Calcium fluoride detector (America).
4.2 Synthesis of PCN-250
In a typical preparation of PCN-250, Fe(NO3)3•9H2O (14 mg, 0.035 mmol), H4ABTC (12.5 mg, 0.035 mmol), 6.9 mL of N,N-dimethylformamide (DMF), 1.35 mL of HAc and 0.2 mL of deionized water were added to a 20 mL vial. The mixture was stirred at room temperature for 15 min. Then, the resulting solution was sealed in a 25 mL Teflon-lined stainless-steel vessel and maintained at 140 ℃ for 48 h. After cool down, the red crystals were harvested through centrifugation and washed with DMF for three times, followed by washing with ethanol repeatedly. Finally, the as-obtained product was dried under vacuum at 80 ℃ overnight for further characterization.
4.3 Synthesis of the WO3 nanoparticles
In a typical procedure, 2.0 g of Na2WO4•2H2O was dissolved in 80 mL of deionized water in a three-necked round-bottom flask equipped with reflux condenser under stirring. The mixture was heated to 70 ℃, followed by addition of 1.224 g of sodium dodecyl benzene sulfonate (SDBS). After 20 min of controlled agitation, 80 mL of concentrated sulfuric acid was introduced dropwise into the reaction system while maintaining precise thermal regulation of the internal temperature below 100 ℃. Then, the mixture was heated at 160 ℃ for 5.0 h. After cooled to room temperature, the obtained sample was washed with deionized water and ethanol for several times. After vacuum drying at 80 ℃ overnight, the sample was thermally treated in an air atmosphere with a controlled heating ramp of 5 ℃/min, followed by isothermal holding at 350 ℃ for 1 h.
4.4 Synthesis of W@P-x
The peroxotungstic acid stock solution was prepared by dissolving 0.4 g of WO3 in 10 mL of 30% H2O2 with constant stirring at 60 ℃ for 5 h. After natural cooling to room temperature, a specific volume of the peroxotungstic acid solution and 25 mg of PCN-250 were added to 10 mL of ethanol (EtOH), followed by continuous stirring at (24±0.5) ℃ for 12 h. To regulate the loading amount of nanoclusters within PCN-250, different volumes of the precursor solution were employed (Table S1). The resulting mixture was evaporated at ambient temperature to yield precipitates, which were washed twice with deionized water. The final products were vacuum-dried at 80 ℃ overnight for subsequent characterization.
4.5 Synthesis of W/P-2
A homogeneous suspension was prepared by dispersing 11 mg of WO3 and 25 mg of PCN-250 in 30 mL of deionized water under continuous stirring. After stirring at room temperature for 30 min, it was transferred to a 50 mL of Teflon-lined stainless-steel vessel and maintained at 120 ℃ for 2 h. After cooling to room temperature, the obtained sample was washed several times with deionized water. The product was dried in vacuum at 80 ℃ overnight, and the obtained powder was collected for further characterization.
4.6 Synthesis of W@C
The peroxotungstic acid stock solution was prepared by dissolving 0.4 g of WO3 in 10 mL of 30% H2O2 with constant stirring at 60 ℃ for 5 h. After natural cooling to room temperature, 50 μL of peroxotungstic acid solution and 25 mg of porous carbon aerogel were added to 10 mL of EtOH, followed by continuous stirring at (24±0.5) ℃ for 12 h. The resulting mixture was evaporated at ambient temperature to yield precipitates, which were washed twice with deionized water. The final products were vacuum-dried at 80 ℃ overnight for subsequent characterization.
(Zhao, C.)