1 引言
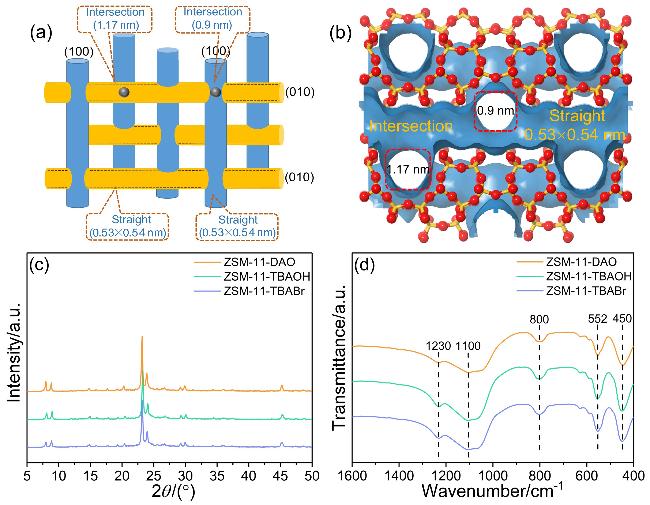
图1 ZSM-11分子筛的宏观(a)和微观(b)孔道结构示意图; 各种ZSM-11分子筛的XRD谱图(c)和在1600~400 cm−1范围内的FT-IR谱图(d)Figure 1 Schematic representation of pore architectures of ZSM-11 zeolite at the macroscopic (a) and microscopic (b) scales; the XRD patterns (c) and FT-IR spectra (d) in the region 1600~400 cm−1 of various ZSM-11 zeolites |
2 结果与讨论
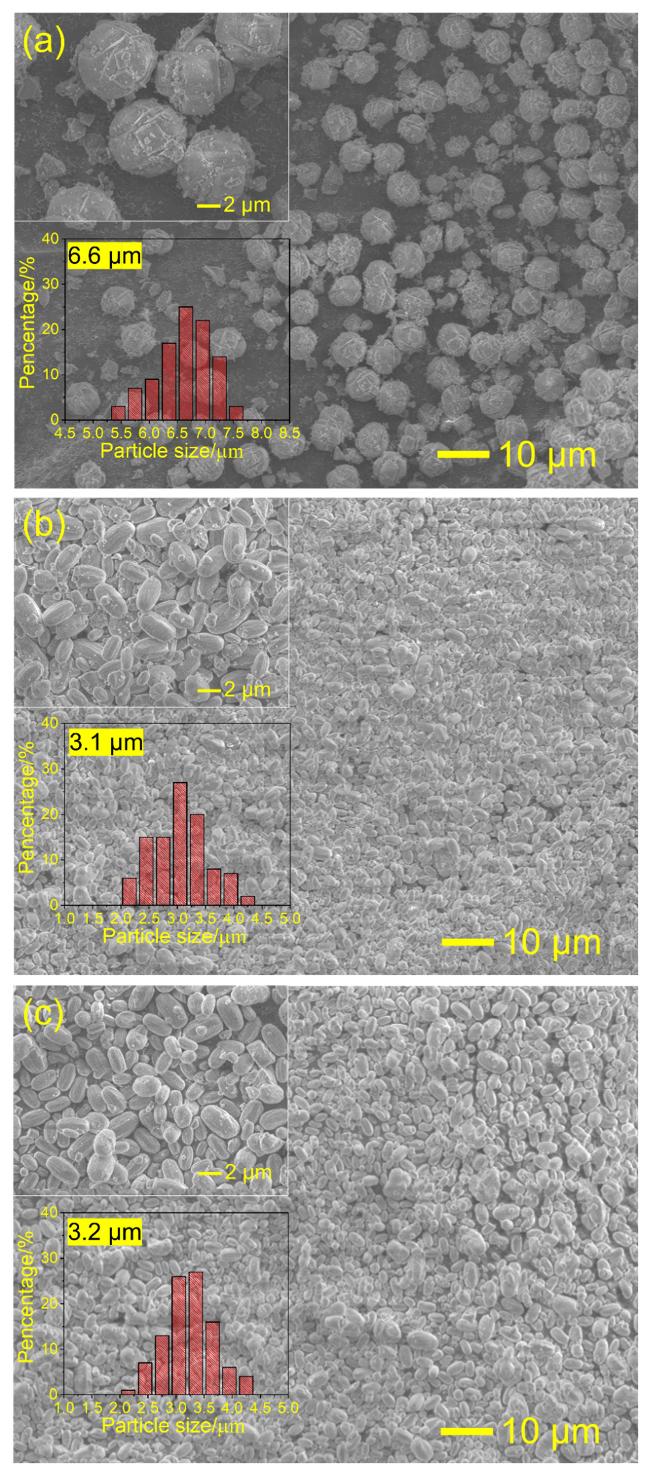
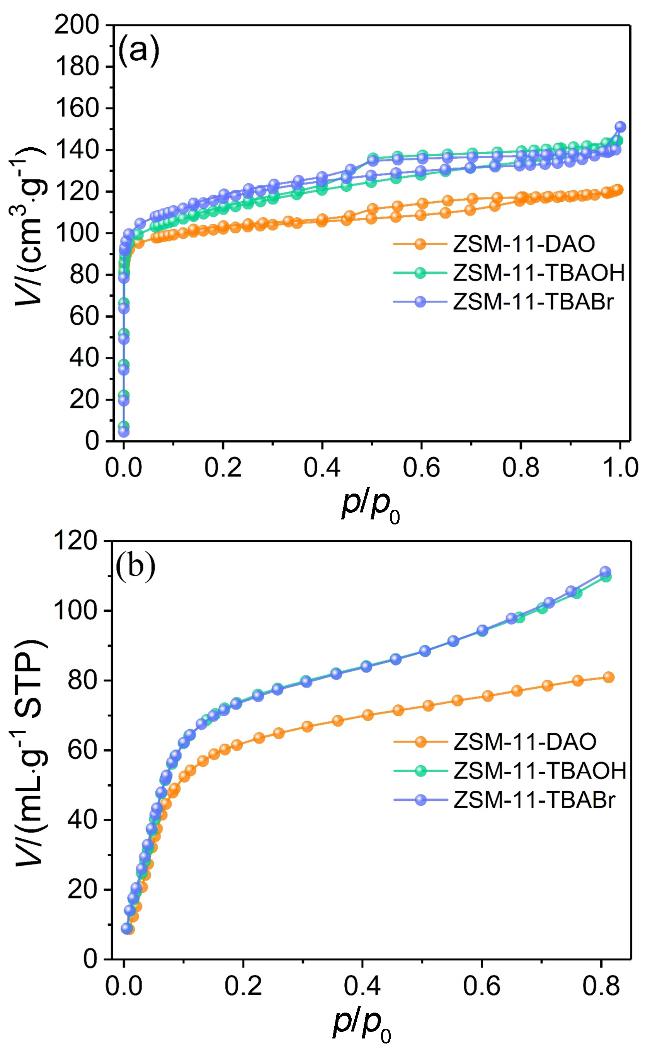
2.1 ZSM-11分子筛的形貌和织构性质
表1 各种ZSM-11分子筛的相对结晶度和织构性质Table 1 Relative crystallinity and textural properties of various ZSM-11 zeolites |
| Zeolites | Crystallinity/% | Surface area/ (m2•g−1) | Pore volume/ (cm3•g−1) | ||
|---|---|---|---|---|---|
| total | micro | total | micro | ||
| ZSM-11-DAO | 100 | 325 | 249 | 0.19 | 0.12 |
| ZSM-11-TBAOH | 100 | 353 | 256 | 0.22 | 0.12 |
| ZSM-11-TBABr | 98 | 368 | 268 | 0.22 | 0.12 |
2.2 ZSM-11分子筛的元素组成和酸性
表2 各种ZSM-11分子筛的元素组成和酸性性质aTable 2 Elemental composition and acidic properties of various ZSM-11 zeolitesa |
| Zeolites | Si/Albulk | NH3-TPD (μmol•g−1) | Py-IR (μmol•g−1) | dTBPy-IR (μmol•g−1) | |||
|---|---|---|---|---|---|---|---|
| strong | weak | total | Brønsted | Lewis | |||
| ZSM-11-DAO | 159 | 84 | 35 | 119 | 51 | 19 | 3 |
| ZSM-11-TBAOH | 177 | 74 | 29 | 103 | 34 | 16 | 5 |
| ZSM-11-TBABr | 178 | 72 | 29 | 101 | 33 | 17 | 2 |
a The bulk Si/Al ratio is measured by ICP-OES. |
表3 各种ZSM-11分子筛的29Si MAS NMR分峰拟合信号峰的面积占比aTable 3 Proportion of integrated peaks obtained by curve fitting of the 29Si MAS NMR spectra of various ZSM-11 zeolitesa |
| Zeolites | Si/AlF | Q3(Si(OAl)1(OSi)3) silicon/% | Q4(Si(OSi)4) silicon distribution/% | |||
|---|---|---|---|---|---|---|
| 104 | -109.6 | -112.3 | -113.7 | -115.7 | ||
| ZSM-11-DAO | 165 | 2.4 | 5.7 | 25.4 | 38.8 | 27.7 |
| ZSM-11-TBAOH | 184 | 2.2 | 6.2 | 31.9 | 32.6 | 27.1 |
| ZSM-11-TBABr | 186 | 2.2 | 4.9 | 26.8 | 39.4 | 26.7 |
a The framework Si/Al ratio is obtained from the deconvolution results of 29Si MAS NMR spectra, according to the equation of Si/Al=(IQ4+IQ3)/0.25IQ3, where IQ4 and IQ3 are the intensity of Q4 (Si(OSi)4) and Q3 (Si(OAl)1(OSi)3) peaks, respectively. Four Q4 (Si(OSi)4) peaks at δ -115.7, -113.7, -112.3 and -109.6 appear in the 29Si MAS NMR spectra, which can be roughly attributed to Si located at T6, T3+T4+T5, T2, and T1+T7 sites, respectively. |
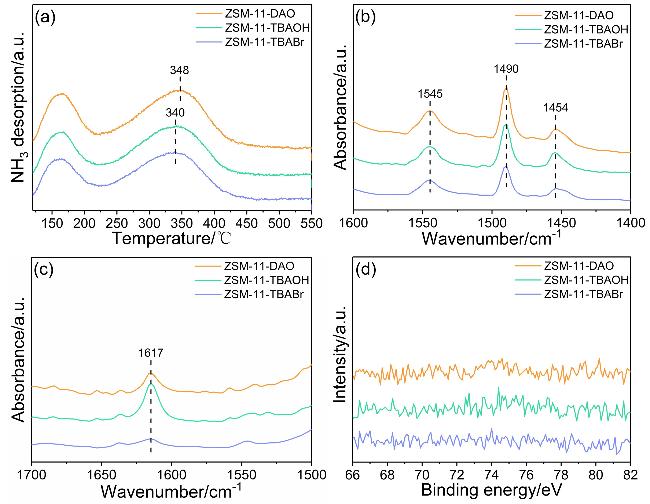
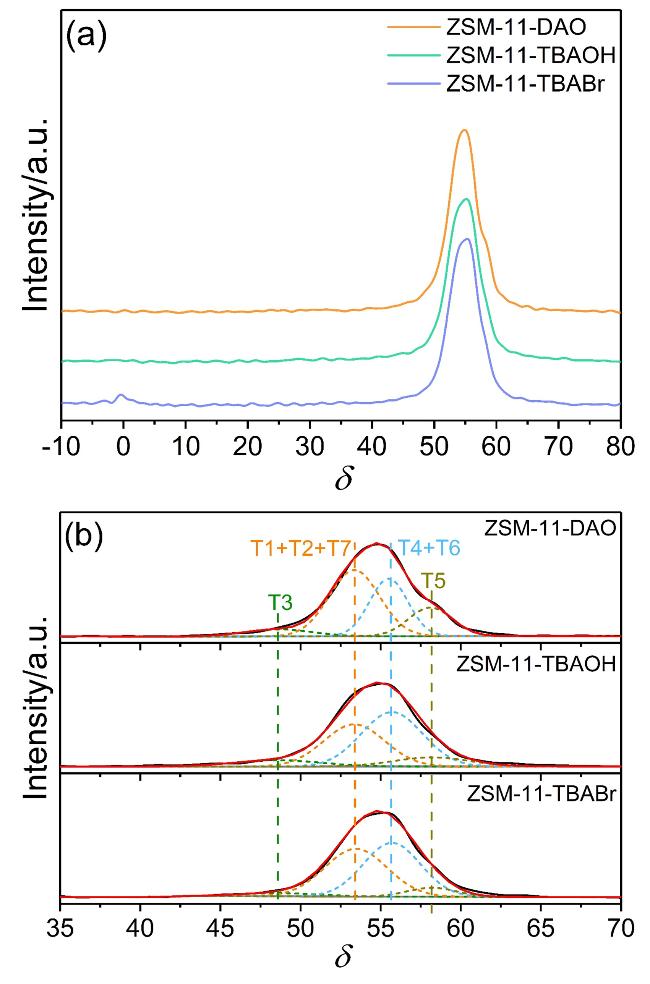
图5 各种ZSM-11分子筛的铝核磁(a)及其分峰拟合谱图(b)Figure 5 27Al MAS NMR spectra (a) as well as deconvoluted ones (b) of various ZSM-11 zeolites |
表4 各种ZSM-11分子筛的27Al MAS NMR分峰拟合信号峰的面积占比aTable 4 Proportion of integrated peaks obtained by curve fitting of the 27Al MAS NMR spectra of various ZSM-11 zeolitesa |
| Zeolites | AlF/% | AlEF/% | Aluminum distribution/% | |||
|---|---|---|---|---|---|---|
| 48.5 | 53.2 | 55.6 | 58.1 | |||
| ZSM-11-DAO | 100 | 0 | 6.7 | 45.9 | 30.2 | 17.2 |
| ZSM-11-TBAOH | 100 | 0 | 7.9 | 36.0 | 46.3 | 9.8 |
| ZSM-11-TBABr | 99 | 1 | 3.9 | 44.2 | 45.4 | 6.5 |
a AlF and AlEF denote the percentages of Al atoms residing in the framework and extra-framework, respectively, derived from the relative intensities of the signals at δ 45~65 and 0 in the 27Al MAS NMR spectra. The proportions of individual peaks are calculated by dividing their intensity by the total intensity of signals in the range of δ 45~65. The peaks at δ 48.5, 55.6, and 58.1 are attributed to Al atoms at T3, T4+T6, and T5 sites, respectively, which are located in the intersection cavity, whereas the peak at δ 53.2 corresponds to Al atoms at T1+T2+T7 sites in the straight channel. |
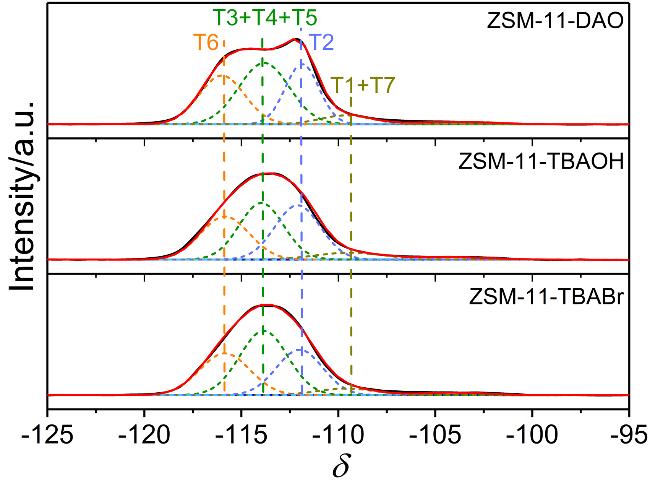
表5 各种Co(II)-ZSM-11分子筛中不同类型铝物种的占比aTable 5 Proportion of different types of Al species in various Co(II)-ZSM-11 zeolitesa |
| Zeolites | Alpairs/% | Alsingle/% | Aluminum distribution/% | ||
|---|---|---|---|---|---|
| α | β | γ | |||
| ZSM-11-DAO | 26.1 | 73.9 | 26.8 | 53.8 | 19.4 |
| ZSM-11-TBAOH | 63.2 | 36.8 | 16.4 | 62.9 | 20.7 |
| ZSM-11-TBABr | 63.4 | 36.6 | 28.4 | 54.8 | 16.8 |
a The proportions of Alpairs and Alsingle are calculated as [Alpairs]=2×[Co] and [Alsingle]=[Altotal]-[Alpairs], where [Altotal] and [Co] are the contents of Al and Co in various Co(II)-ZSM-11 zeolites, respectively, measured by ICP-OES. The α+γ type Al corresponds to that sited in the straight channel, whereas the β type Al is attributed to that in the intersection cavity. |
2.3 不同有机模板剂合成的ZSM-11分子筛MTP催化性能
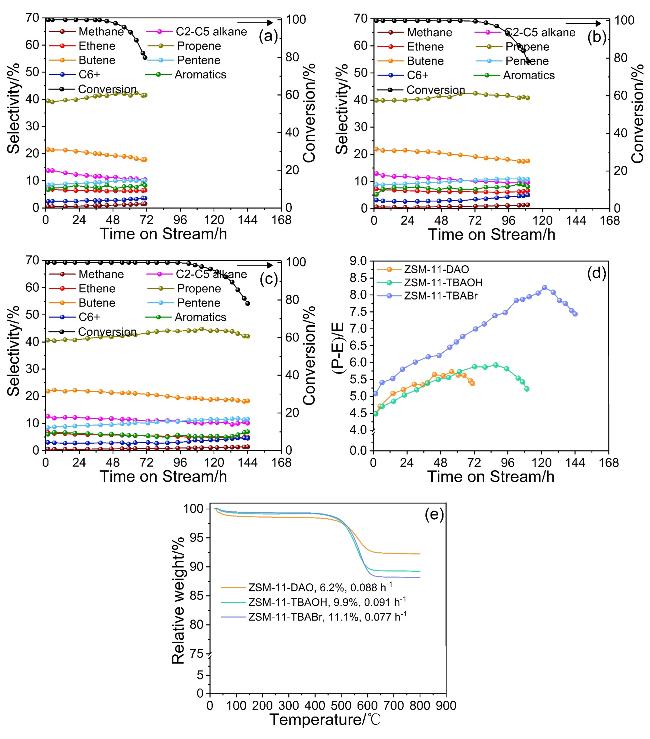
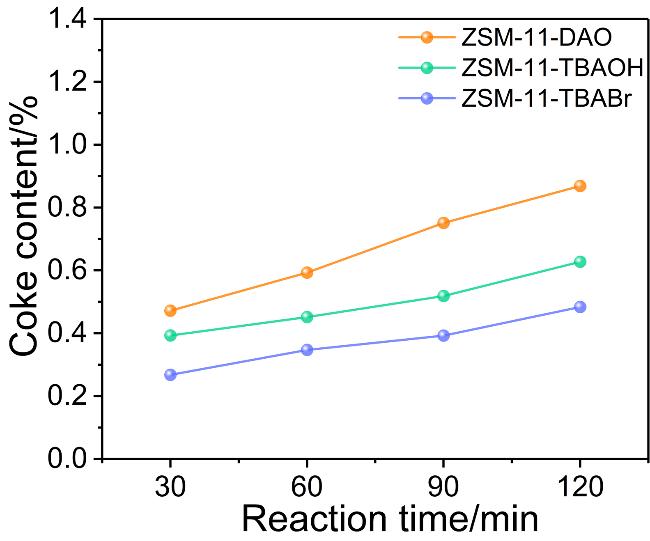
图8 ZSM-11-DAO (a)、ZSM-11-TBAOH (b)和ZSM-11-TBABr (c)分子筛催化MTP反应中的甲醇转化率、产物选择性以及(P-E)/E值(d)随反应时间的变化; 各种失活ZSM-11分子筛的热重失重曲线(e)Figure 8 Methanol conversion and product selectivity as a function of time on stream for MTP over ZSM-11-DAO (a), ZSM-11-TBAOH (b) and ZSM-11-TBABr (c); the (P-E)/E ratio (d) as a function of time on stream over the same three zeolites; TGA curves of various spent ZSM-11 zeolites (e). The reactions are performed at 430 ℃ and methanol WHSV of 2.9 h−1 under atmospheric pressure |
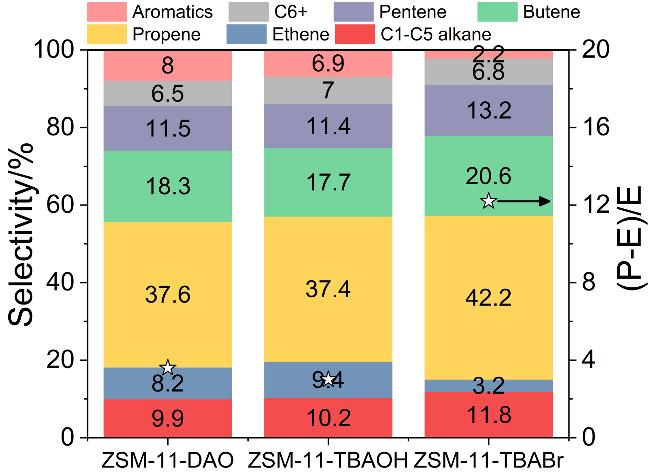
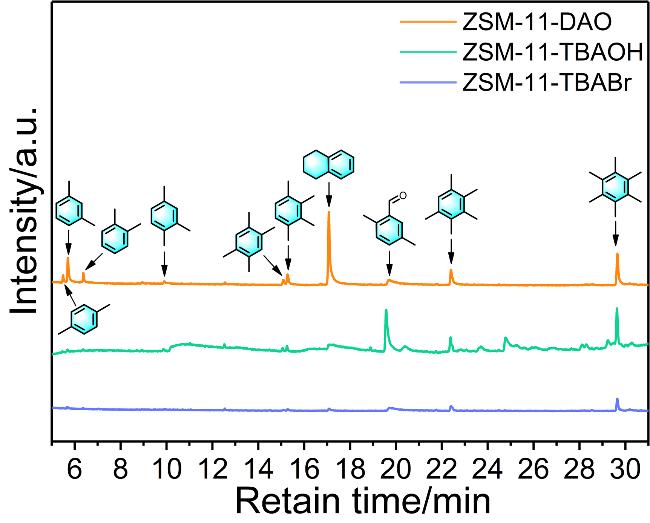
图10 在380 ℃、WHSV为2.9 h−1条件下通入甲醇反应30 min后, 残留在各种积碳ZSM-11分子筛上的有机物种经二氯甲烷萃取所得可溶部分的GC-MS谱图Figure 10 GC-MS chromatogram of the CH2Cl2 soluble fraction of the retained organic species extracted from various carbon-deposited ZSM-11 zeolites after methanol reaction for 30 min at 380 ℃ and with a WHSV of 2.9 h−1 |
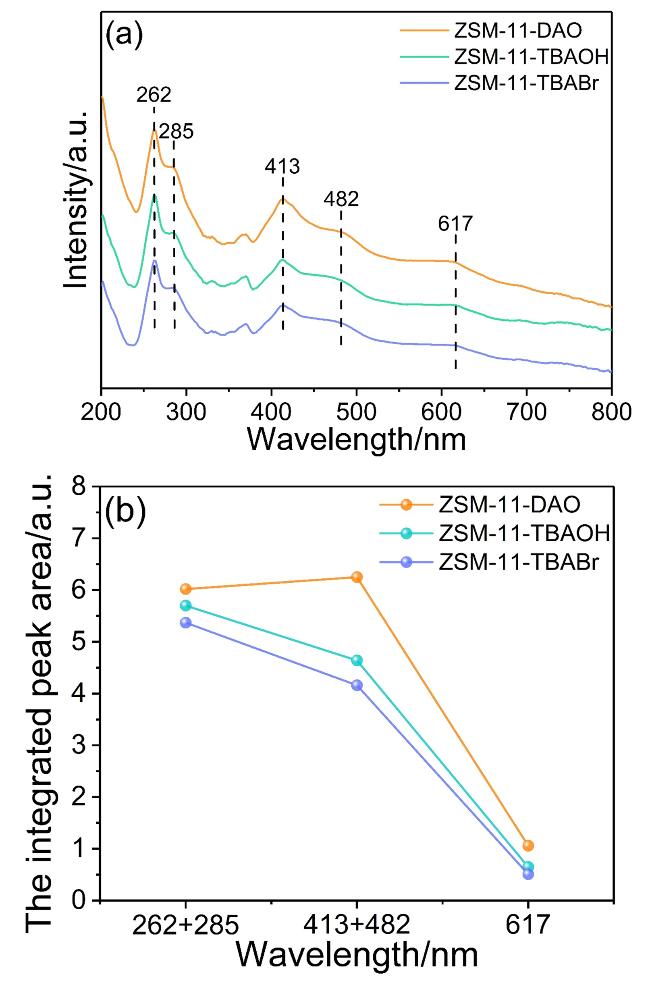
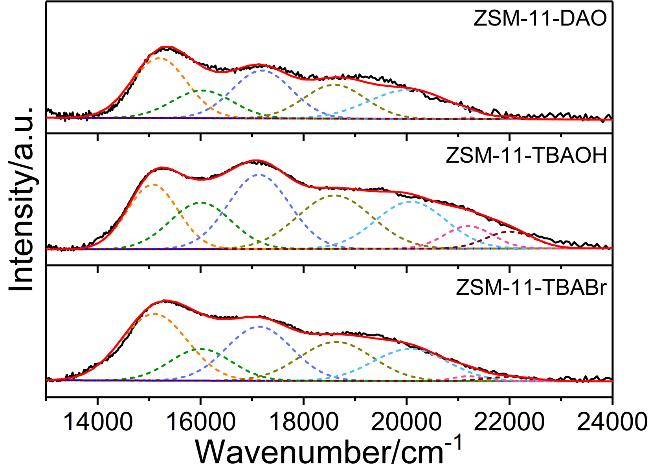
图12 在380 ℃、WHSV为2.9 h−1条件下通入甲醇反应30 min后各种积碳ZSM-11分子筛的紫外-可见光漫反射光谱图(a)以及分峰拟合后特征吸收峰的积分峰面积(b)Figure 12 The UV-vis spectra of various carbon-deposited ZSM-11 zeolites after methanol reaction for 30 min at 380 ℃ and with a WHSV of 2.9 h−1 (a), together with the integrated areas of the characteristic absorption bands derived from peak deconvolution (b) |