

1 引言
2 结果与讨论
2.1 固态纳米孔检测单链DNA
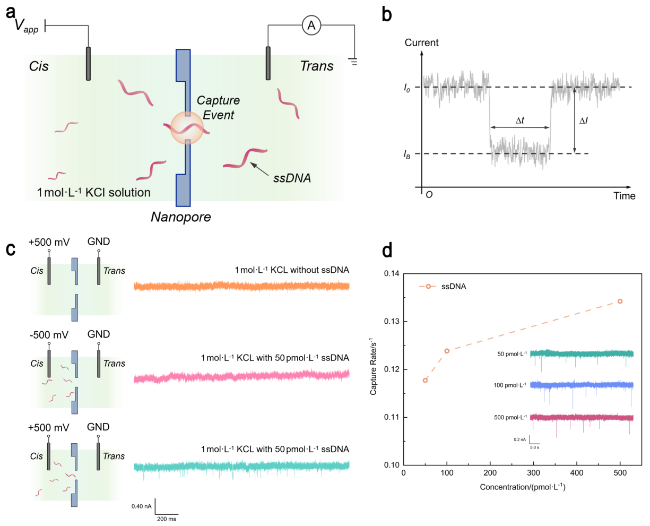
图1 (a)使用固态纳米孔检测DNA分子的原理图. (b)实验中典型的电流阻塞事件. (c)不同条件下的离子电流信号. (d)待检测的ssDNA捕获率与浓度的非线性依赖性. 其中插图为50、100、500 pmol•L−1浓度的ssDNA溶液通过纳米孔的离子电流信号Figure 1 (a) Principle of nanopore-based device for DNA molecules detection. (b) A typical current blockade event in experiments. (c) Ion current traces under different conditions. (d) Saturating nonlinearity relationship between concentration and the capture rate of the target ssDNA. The Inset shows current traces for 50, 100, and 500 pmol•L−1 ssDNA |
2.2 动态竞争理论模型及数值仿真
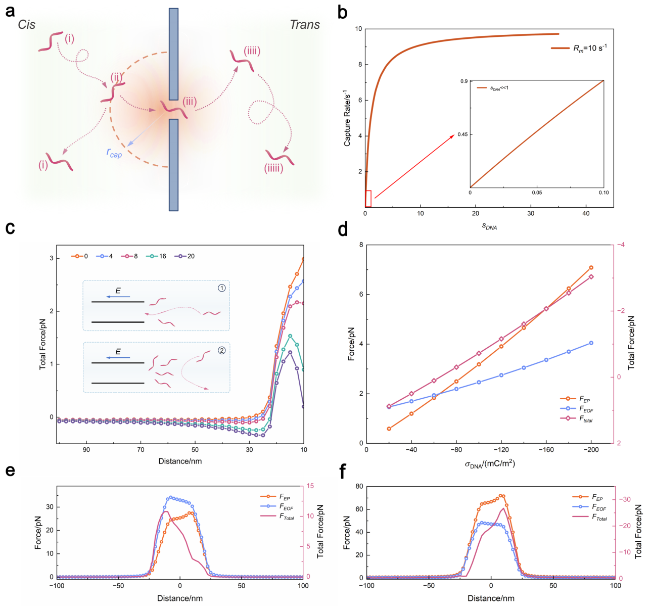
图2 (a) DNA分子通过纳米孔完整动力学过程的模型示意图. 其中状态i为非捕获区的自由扩散的DNA分子, 状态ii为半捕获区内的DNA分子, 状态iii为被纳米孔捕获的DNA分子, 状态iiii到状态iiiii为DNA分子逐渐脱离纳米孔束缚的过程. (b)实际捕获率与相对吸附比的关系曲线. (c) DNA分子在易位过程中受到的合力变化. (d)单个ssDNA在纳米孔孔口受到的电泳力、电渗力与合力大小与DNA表面电荷密度的关系. 模型中的纳米孔直径为5nm. (e, f) ssDNA与dsDNA易位过程中受到的电泳力、电渗力与合力变化Figure 2 (a) Schematic illustration of the complete kinetic process of DNA molecules translocating through a nanopore. State i represents DNA molecules freely diffusing in the non-capture region. State ii represents DNA molecules in the semi-capture region. State iii represents DNA molecules captured by the nanopore. States iiii to iiiii represent the process of DNA molecules gradually escaping from the nanopore. (b) Relationship curve between the actual capture rate and the relative adsorption ratio. (c) Variation of the total force acting on DNA molecules during the translocation process. (d) Electrophoretic force, electroosmotic force, and total force acting on a single ssDNA at the nanopore entrance as a function of DNA surface charge density. The nanopore diameter in the model is 5 nm. (e, f) Electrophoretic force, electroosmotic force, and total force acting on ssDNA and dsDNA during the translocation process |
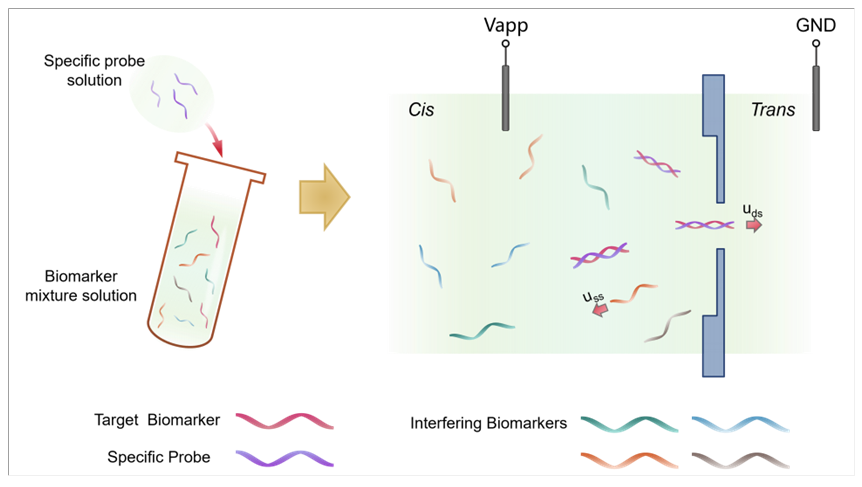
2.3 探针法实现ssDNA的构象转换
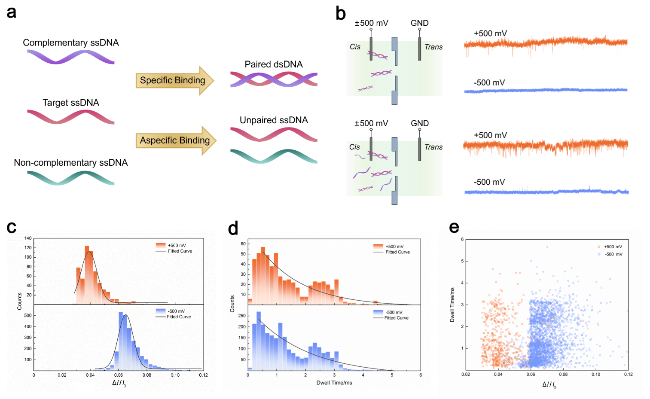
图3 (a) ssDNA具有特异性结合的性质. (b)在±500 mV外加电压下, 混合的DNA溶液通过纳米孔的装置示意图与离子电流信号. 其中上图为dsDNA溶液, 下图为n(dsDNA):n(ssDNA)=1:1的分子溶液. (c, d) ssDNA(橙)和dsDNA(蓝)通过5.3 nm纳米孔的幅值占位比和过孔时间直方图. (e) ssDNA(橙)和dsDNA(蓝)通过5.3 nm纳米孔的过孔时间与占位比分布散点图Figure 3 (a) The specific binding property of ssDNA. (b) Schematic illustration of mixed DNA translocation through a nanopore and the corresponding current traces under ±500 mV applied voltage. The upper panel shows the dsDNA solution, while the lower panel shows the mixed solution of dsDNA:ssDNA at a ratio of 1:1. (c, d) Histograms of amplitude occupancy ratio (c) and dwell time (d) for ssDNA (orange) and dsDNA (blue) through a 5.3 nm nanopore under ±500 mV voltage. (e) Scatter plot of translocation time versus amplitude occupancy ratio for ssDNA (orange) and dsDNA (blue) through a 5.3 nm nanopore |
2.4 构象转换策略实现浓度敏感的定量检测
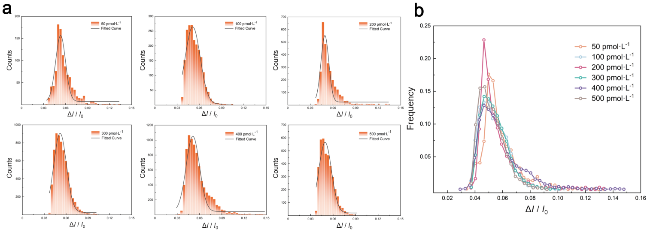
图4 (a)不同浓度dsDNA溶液通过直径为7 nm的纳米孔的幅值占位比直方图. 溶液浓度分别为50、100、200、300、400、500 pmol•L−1. (b)不同浓度dsDNA溶液通过直径为7 nm的纳米孔的幅值占位比的频率点线图.Figure 4 (a) Histograms of amplitude ratio of different concentrations of dsDNA solutions through a 7 nm nanopore. The solution concentrations are 50, 100, 200, 300, 400, and 500 pmol•L−1, respectively. (b) Dotted line plot of amplitude ratio of different concentrations of dsDNA solutions through a 7 nm nanopore |
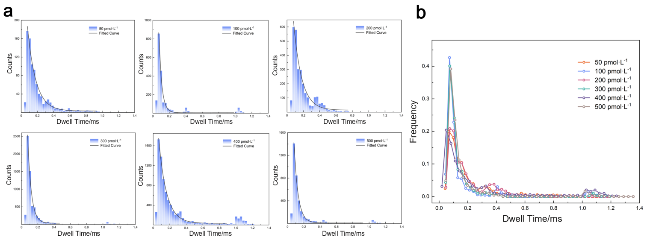
图5 (a)不同浓度dsDNA溶液通过直径为7 nm的纳米孔的过孔时间直方图. 溶液浓度分别为50、100、200、300、400、500 pmol•L−1. (b)不同浓度dsDNA溶液通过直径为7 nm的纳米孔的过孔时间的频率点线图Figure 5 (a) Histograms of dwell time of different concentrations of dsDNA solutions through a 7 nm nanopore. The solution concentrations are 50, 100, 200, 300, 400, and 500 pmol•L−1, respectively. (b) Dotted line plot of dwell time of different concentrations of dsDNA solutions through a 7 nm nanopore |
