

1 引言
2 结果与讨论
2.1 样品的结构表征
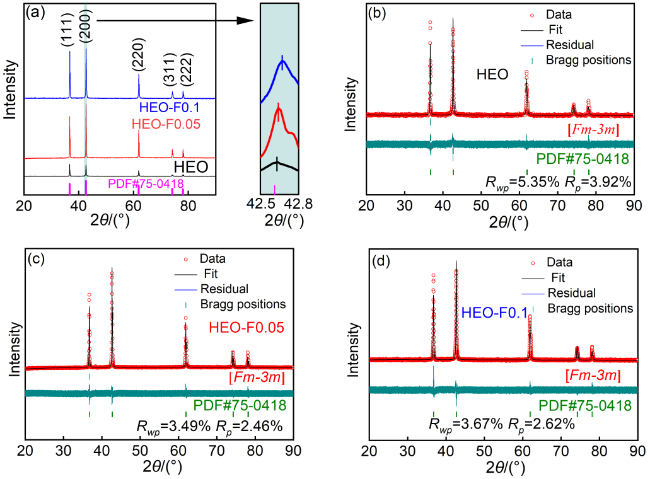
表1 三组样品的晶胞参数和精修因子Table 1 The lattice constants and refinement factors of as-synthesized three samples |
| Sample | a/nm | b/nm | c/nm | V/nm3 | Rwp | Rp |
|---|---|---|---|---|---|---|
| HEO | 0.42389 | 0.42389 | 0.42389 | 0.07617 | 5.35% | 3.92% |
| HEO-F0.05 | 0.42369 | 0.42369 | 0.42369 | 0.07606 | 3.49% | 2.46% |
| HEO-F0.1 | 0.42351 | 0.42351 | 0.42351 | 0.07596 | 3.67% | 2.62% |

图2 样品HEO (a1,b1,c1)、HEO-F0.05 (a2,b2,c3)和HEO-F0.1 (a3,b3,c3)不同放大倍数的SEM图和EDS mapping图及样品HEO (d1,e1,f1)和HEO-F0.05 (d2,e2,f2)的TEM图(插图为SAED花样)、HR-TEM(插图为IFFT图像)和晶格条纹线扫描强度分布曲线Figure 2 SEM images (different magnifications) and EDS elemental maps of HEO (a1,b1,c1), HEO-F0.05 (a2,b2,c2), and HEO-F0.1 (a3,b3,c3). TEM images (with insets showing SAED patterns), HR-TEM images (with insets showing IFFT images), and line scan intensity distribution curves of lattice fringes for samples HEO (d1,e1,f1) and HEO-F0.05 (d2,e2,f2) |
表2 样品的质构参数Table 2 Textural characteristics of as-synthesized samples |
| Sample | SBET/(m2•g-1) | VBJH/(cm3•g-1) | Daver./nm | Dmost/nm |
|---|---|---|---|---|
| HEO | 7.564 | 0.022 | 11.474 | 3.278 |
| HEO-F0.05 | 18.810 | 0.016 | 3.399 | 3.092 |
| HEO-F0.1 | 9.200 | 0.018 | 11.740 | 3.290 |
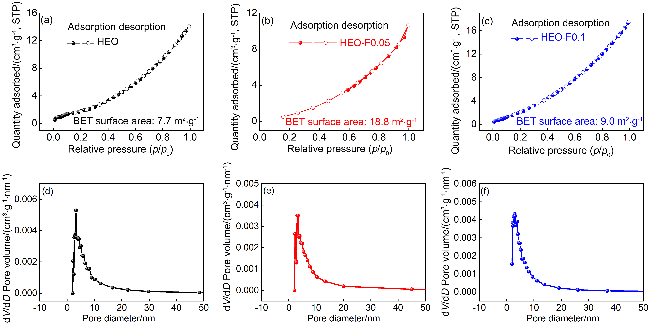
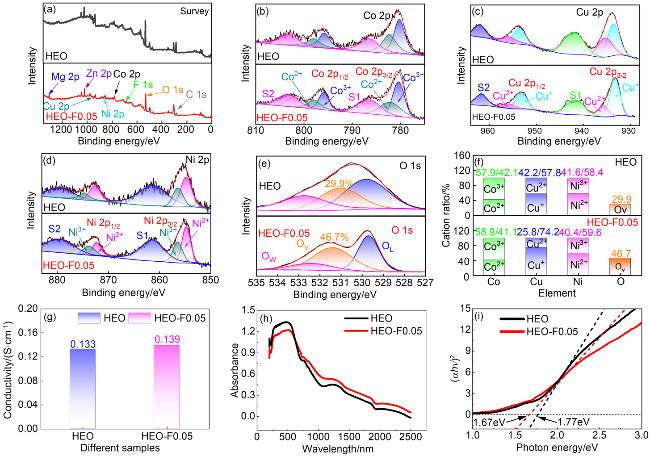
图4 样品的XPS全谱图(a), Co 2p (b)、Cu 2p (c)、Ni 2p (d)、O 1s (e)的高分辨率XPS谱及不同元素价态分布比例(f)、电导率(g)、UV-Vis光谱(h)及[F(R∞)•hν]1/n与hν关系曲线(i)Figure 4 The XPS survey spectrum of the sample (a), high-resolution XPS spectra of Co 2p (b), Cu 2p (c), Ni 2p (d), and O 1s (e), valence state distribution ratios of different elements (f), electrical conductivity (g), UV-Vis spectrum (h), and the plot of [F(R∞)•hν]1/n versus hν (i) |
2.2 电化学性能
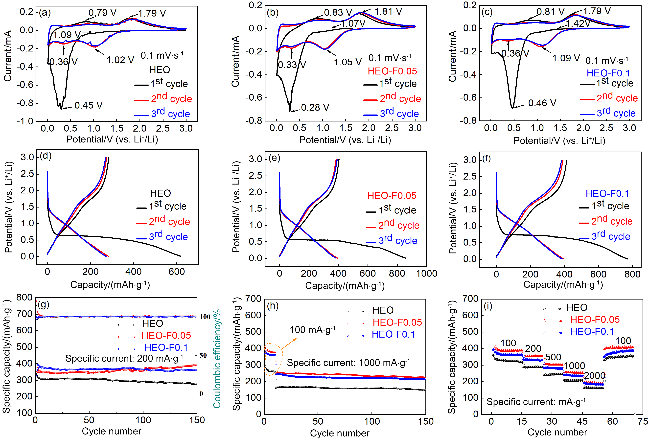
图5 HEO、HEO-F0.05、HEO-F0.1电极在0.1 mV•s-1扫速下的CV曲线(a~c)、充放电曲线(d~f); 不同电流密度下的循环性能以及倍率性能(g~i)Figure 5 Cyclic voltammetry curves (a~c), charge-discharge curves (d~f) and cycling behaviour at different current densities and multiplication behaviour (g~i) of HEO, HEO-F0.05 and HEO-F0.1 electrodes at 0.1 mV•s-1 |

图6 三种电极首次充放电过程中的原位阻抗(a~f); HEO-F0.05第二圈(g)和第三圈(h)放电过程中的原位阻抗以及循环不同圈数的阻抗谱(i); 循环前的电化学阻抗谱及等效电路图(j); 三电极恒电流间歇滴定技术(GITT)曲线(k)以及充放电过程中锂离子的扩散系数(l)Figure 6 In-situ impedance during the first charge-discharge of three electrodes (a~f); in-situ impedance of HEO-F0.05 during 2nd (g) and 3rd (h) discharge and impedance spectra after cycling (i); electrochemical impedance spectra and equivalent circuit before cycling (j); galvanostatic intermittent titration technique (GITT) curves (k) and Li⁺ diffusion coefficients during charge-discharge (l) for three electrodes |
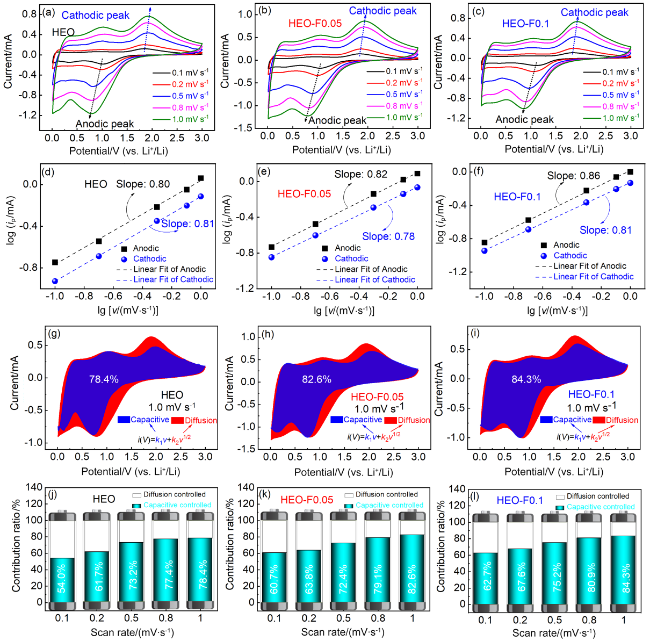
图7 HEO、HEO-F0.05、HEO-F0.1电极不同扫速下的CV曲线(a~c); lg(ip)与lg(v)的关系曲线(d~f); 1.0 mV•s-1时赝电容的贡献率(g~i); 在不同扫描速率下赝电容的贡献率(j~l)Figure 7 CV curves of HEO, HEO-F0.05 and HEO-F0.1 electrodes at different sweeping rates (a~c); lg(ip) versus lg(v) (d~f); Percentage contribution of pseudocapacitance at 1.0 mV•s-1 (g~i); Contribution ratios of pseudocapacitance at different scan rates (j~l) |