


1 引言
2 结果与讨论
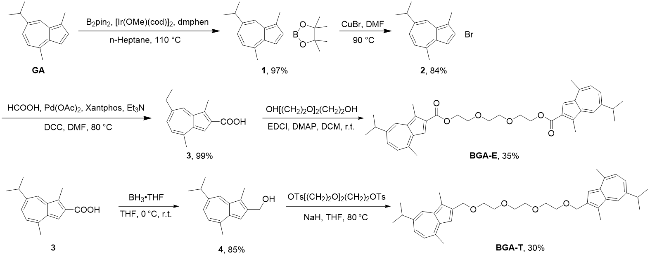
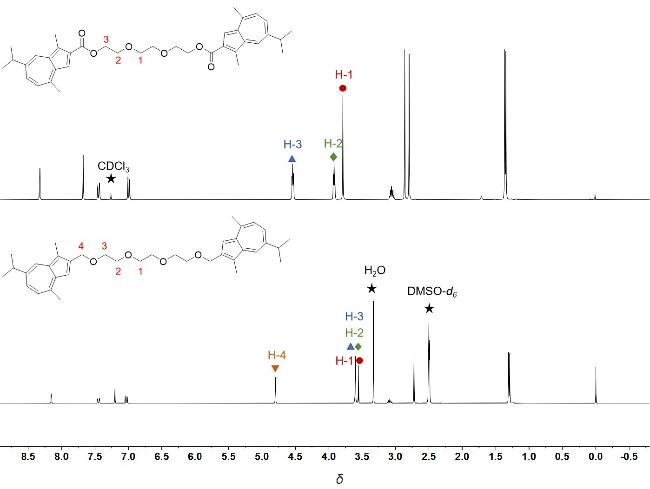
2.1 合成与表征
2.2 体外抗氧化能力研究
2.2.1 DPPH自由基清除法测定抗氧化能力
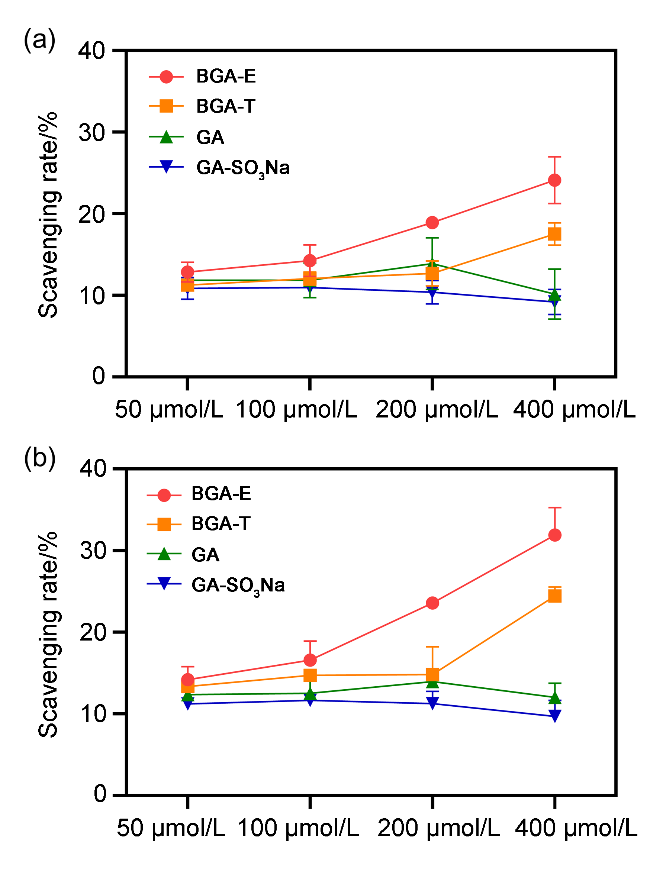
图4 不同浓度的化合物分别在0.5 h (a)和4 h (b)时对DPPH自由基的清除率Figure 4 The scavenging rates of different concentrations of compounds against DPPH radicals at 0.5 h (a) and 4 h (b) Data are given as mean±standard error of mean (SEM). Statistical analysis is performed by oneway analysis of variance (ANOVA). **p<0.01 |
表1 不同浓度的化合物在0.5 h和4 h时对DPPH自由基的清除率Table 1 The scavenging rates of different concentrations of compounds against DPPH radicals at 0.5 h and 4 h |
| 化合物 | 时间/h | 自由基清除率a/% | |||
|---|---|---|---|---|---|
| 50 μmol•L−1 | 100 μmol•L−1 | 200 μmol•L−1 | 400 μmol•L−1 | ||
| BGA-E | 0.5 | 12.86 | 14.25 | 18.90 | 24.13 |
| 4 | 14.19 | 16.58 | 23.58 | 31.91 | |
| BGA-T | 0.5 | 11.25 | 12.06 | 12.70 | 17.52 |
| 4 | 13.35 | 14.72 | 14.83 | 24.44 | |
| GA | 0.5 | 11.84 | 11.86 | 13.88 | 10.15 |
| 4 | 12.35 | 12.51 | 13.91 | 12.03 | |
| GA-SO3Na | 0.5 | 10.86 | 10.95 | 10.40 | 9.20 |
| 4 | 11.23 | 11.64 | 11.24 | 9.69 | |
a Calculated by the formula. |
2.2.2 FRAP法测定抗氧化能力
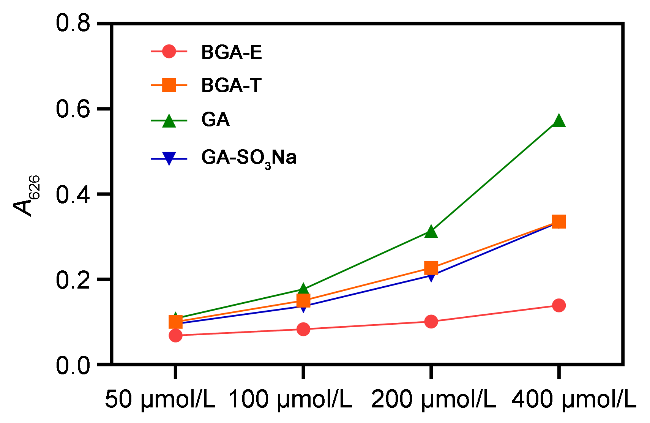
图5 FRAP法测定不同浓度化合物的OD值Figure 5 Measurement of OD values for compounds at different concentrations by FRAP assay Data are given as mean±SEM |
表2 FRAP 法测定化合物的OD值Table 2 Measurement of OD values for compounds at different concentrations by FRAP assay |
| 化合物 | OD值 | |||
|---|---|---|---|---|
| 50 μmol•L−1 | 100 μmol•L−1 | 200 μmol•L−1 | 400 μmol•L−1 | |
| BGA-E | 0.0685 | 0.0827 | 0.1011 | 0.1389 |
| BGA-T | 0.1005 | 0.1503 | 0.2267 | 0.3357 |
| GA | 0.1084 | 0.1772 | 0.3135 | 0.5741 |
| GA-SO3Na | 0.0955 | 0.1370 | 0.2090 | 0.3346 |
2.3 体外抗炎能力研究
2.3.1 Griess法测试化合物对LPS诱导的RAW 264.7细胞炎症模型的NO抑制率
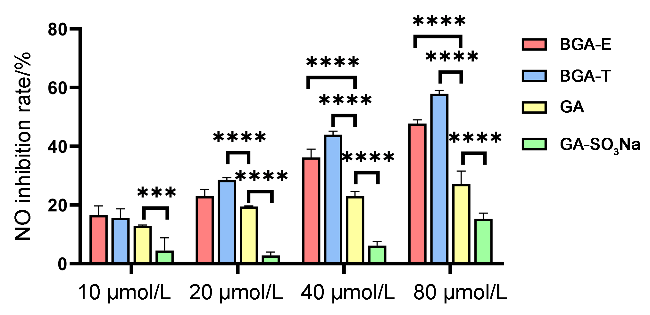
图6 不同浓度的化合物对LPS诱导的RAW 264.7细胞炎症模型的NO抑制率Figure 6 NO inhibition rates of compounds at various concentrations in LPS-stimulated RAW 264.7 cells Data are given as mean±SEM. Statistical analysis is performed by Two-way analysis of variance (ANOVA). ****p<0.0001, ***p<0.001, **p<0.01 compared to GA and GA-SO3Na |
表3 不同浓度的化合物对LPS诱导的RAW 264.7细胞炎症模型的NO抑制率Table 3 NO inhibition rates of compounds at various concentrations in LPS-stimulated RAW 264.7 cells |
| 化合物 | 浓度/(μmol•L−1) | 抑制率a/% |
|---|---|---|
| BGA-E | 10 | 16.60 |
| 20 | 23.01 | |
| 40 | 36.23 | |
| 80 | 47.75 | |
| BGA-T | 10 | 15.61 |
| 20 | 28.57 | |
| 40 | 43.99 | |
| 80 | 57.92 | |
| GA | 10 | 12.88 |
| 20 | 19.52 | |
| 40 | 23.05 | |
| 80 | 27.19 | |
| GA-SO3Na | 10 | 4.49 |
| 20 | 2.85 | |
| 40 | 6.18 | |
| 80 | 15.32 | |
| 模型组 | — | 0 |
a Calculated by the formula. |
2.3.2 化合物对LPS诱导的小鼠RAW 264.7巨噬细胞中促炎因子TNF-α和IL-6的影响
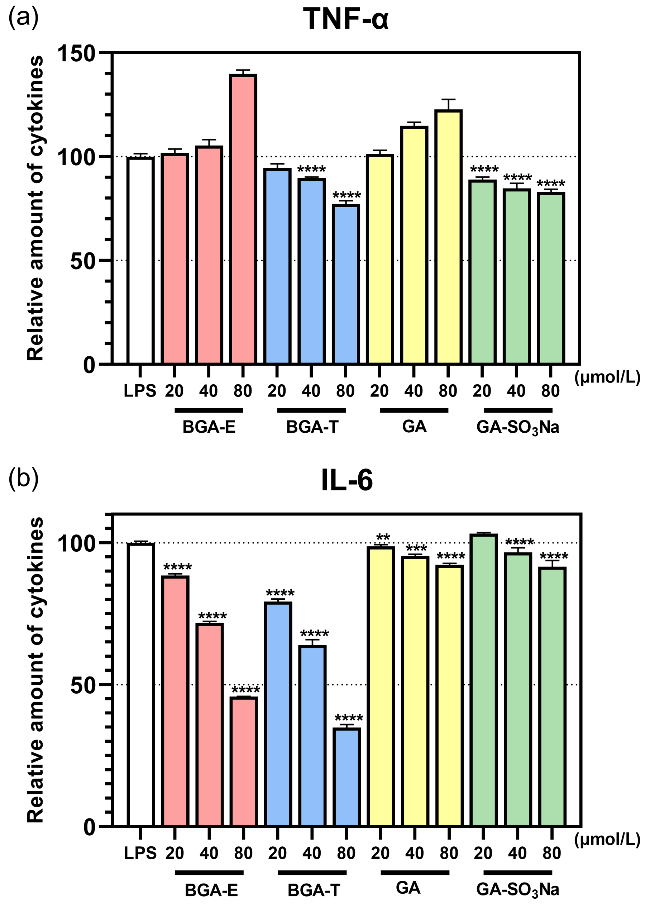
图7 不同化合物对LPS诱导的RAW 264.7细胞中TNF-α (a)和IL-6 (b)相对含量的影响Figure 7 The effect of different compounds on the relative amount of TNF-α (a) and IL-6 (b) in LPS-induced RAW 264.7 cells Data are given as mean±SEM. Statistical analysis is performed by Two-way analysis of variance (ANOVA). ****p<0.0001, ***p<0.001, **p<0.01 compared to GA and GA-SO3Na |
表4 化合物对LPS诱导的RAW 264.7细胞中TNF-α和IL-6的相对含量Table 4 The relative amounts of TNF-α and IL-6 in LPS-induced RAW 264.7 cells with the compounds |
| 化合物 | 浓度/ (μmol•L−1) | 相对含量a/% | |
|---|---|---|---|
| TNF-α | IL-6 | ||
| BGA-E | 20 | 101.71 | 88.40 |
| 40 | 105.33 | 71.76 | |
| 80 | 139.79 | 45.83 | |
| BGA-T | 20 | 94.47 | 79.25 |
| 40 | 89.67 | 63.89 | |
| 80 | 77.14 | 34.89 | |
| GA | 20 | 101.29 | 98.72 |
| 40 | 114.84 | 95.28 | |
| 80 | 122.68 | 92.17 | |
| GA-SO3Na | 20 | 88.96 | 103.13 |
| 40 | 84.68 | 96.59 | |
| 80 | 82.98 | 91.48 | |
| 模型组 | — | 100.00 | 100.00 |
a Calculated by the formula. |
2.3.3 Western Blot法测化合物对COX-Ⅱ的释放
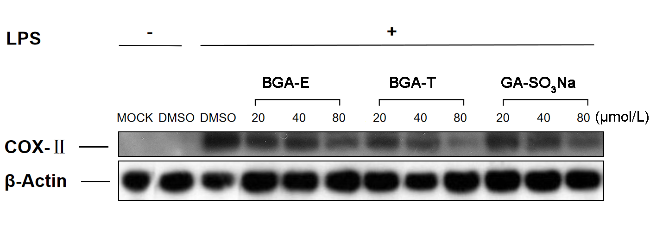
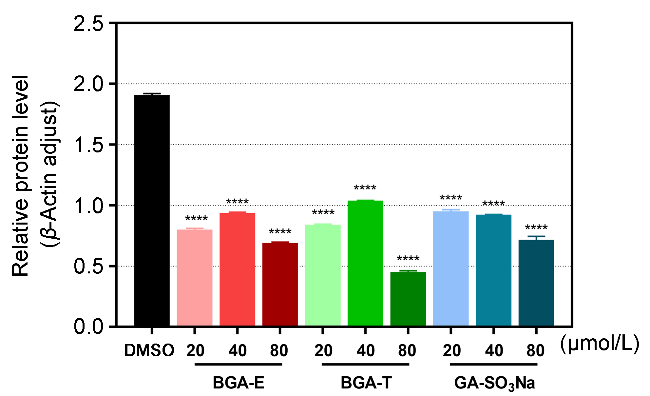
图9 不同化合物对LPS诱导的RAW 264.7细胞中COX-II相对含量的影响Figure 9 The effect of different compounds on the relative amount of COX-II in LPS-induced RAW 264.7 cells Data are given as mean±SEM. Statistical analysis is performed by One-way analysis of variance (ANOVA). ****p<0.0001, ***p<0.001, **p<0.01 compared to DMSO |