


1 引言
在PDH反应体系中, 催化剂性能是决定技术经济性的核心要素. 贵金属Pt基催化剂凭借其优异的C—H键活化能力与较低的C—C键断裂倾向, 成为当前研究的热点方向[5-7]. 然而, 传统Pt催化剂仍面临严峻挑战: 其一, 反应过程中积碳快速沉积导致活性位点覆盖, 引发催化剂失活; 其二, 频繁再生操作会引发催化剂活性位结构发生不可逆改变, 进而导致永久性失活. 针对上述问题, 通过选择合适的载体及助剂调控Pt的电子和几何结构优化其丙烷脱氢性能. 载体的选择对Pt基催化剂的性能具有重要影响, 其中分子筛载体因其独特的孔道结构、可调的表面性质及良好的热稳定性而备受关 注[8-10]. Silicalite-1 (S-1)分子筛作为一种全硅MFI型分子筛, 其规整的三维交叉孔道结构为活性金属提供了理想的限域环境, 有效抑制金属颗粒的烧结和团聚. 与含铝分子筛相比, Silicalite-1的全硅骨架赋予其极低的酸性和优异的热稳定性, 有效避免了酸性位点引起的副反应和积碳形成[11-12]. Zeng等[13]利用S-1孔道限域作用结合In的动态迁移特性, 在分子筛内部构建出Rh-In单原子簇催化剂, 该催化剂可在550 ℃纯丙烷反应气氛中稳定运行5500 h. Xu等[14]通过精确调控S-1分子筛b轴长度(≥2.00 μm), 利用孔道限域实现Pt-Sn₂单体向(Pt-Sn2)2二聚体的孔道自锁, 所制催化剂在550 ℃纯丙烷反应气氛中稳定运行超4500 h, S-1的结构调控有效阻断了Pt物种迁移团聚.
在助剂金属研究中, Fe因具备独特的电子调变能力与抗积碳潜力成为焦点[15]. 邱易等[16]研究表明, 适量Fe的添加能促进催化剂表面Pt金属粒子的分散, 减少反应过程中积碳的产生, 有利于丙烷脱氢反应的进行, 其中PtFe1/Sn-SBA-15催化剂显示出最佳的反应性能, 反应7 h后, 丙烷转化率仍然高达50.7%, 丙烯选择性维持在94.5%以上. 沈姗姗等[17]采用一步水热法制备了原位掺杂Fe的Silicalite-1分子筛载体, 浸渍得到相应的Pt基催化剂, 研究发现较Pt/Silicalite-1催化剂, 原位掺入Fe的Pt/Fe-Silicalite-1催化剂反应性能得到很大程度地提高, 尽管丙烷的初始转化率略有降低, 但丙烯的选择性和催化稳定性大幅提高, 反应8 h后丙烷转化率稳定在43.7%、丙烯选择性达到98.0%, 且在80 h内基本保持不变.
尽管原位掺杂法在调控Pt-Fe相互作用方面取得进展, 但该方法工艺复杂、条件苛刻, 且Fe负载量较低. 相比之下, 共浸渍法具有操作简便、易于工业化放大的优势, 若能通过优化前驱体选择与制备条件, 实现Fe物种的高度分散与强金属-载体相互作用, 则有望在保持催化性能的同时降低成本. 基于此, 本研究以氯铂酸和三氯化铁为前驱体, 通过共浸渍法将Pt与Fe负载于Silicalite-1分子筛, 制备PtFe/Silicalite-1 (PtFe/S-1)系列催化剂. 在保持工艺简单性的同时, 实现Fe对Pt的电子调变与结构稳定化作用, 为高效PDH催化剂的设计提供新思路.
2 结果与讨论
2.1 X射线衍射(XRD)表征结果及分析
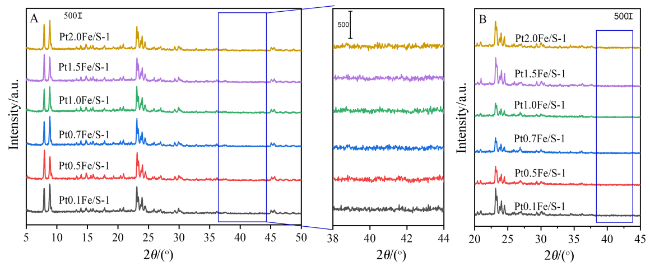
PtFe/S-1催化剂的XRD分析结果如图1所示. 所有样品在2θ为7.9°、8.8°、23.0°、23.9°和24.4°处均呈现典型MFI拓扑结构的特征衍射峰, 分别对应(011)、(200)、(501)、(033)和(133)晶面[18]. 随着Fe负载量(质量分数)从0.1%逐步增加至2.0%, MFI结构特征峰的强度和位置均未发生显著变化, 说明Fe和Pt的负载未对载体的晶体结构产生明显影响. 即使在Pt2.0Fe/S-1催化剂中, 未观察到归属于FeOx或Pt的特征衍射峰, 这表明Fe和Pt物种在Silicalite-1表面实现了高度分散. 通过对XRD图谱的放大分析进一步发现, 即使在高负载量条件下, 仍无金属颗粒的特征衍射峰, 表明金属物种以高度分散的形式存在于载体表面及孔道内.
2.2 N2-吸附脱附表征结果及分析
PtFe/S-1催化剂的N2吸附-脱附表征结果如图2所示. 图2A显示, 该系列催化剂均呈现典型的Ι型吸附-脱附等温线, 表明其具有丰富的微孔结构. 其中, Pt0.1Fe/S-1、Pt0.5Fe/S-1和Pt0.7Fe/S-1在中等相对压力(p/p0=0.4~0.8)出现H4型滞后环, 表明这三种催化剂同时存在微孔与介孔结构; 而当Fe负载量超过0.7%后, 催化剂在高相对压力区(p/p0>0.9)呈现H3型滞后环[21]. 可能源于Fe物种聚集导致的晶间介孔结构变化. 图2B的孔径分布表明, 所有样品的孔径分布均较为均匀, 结合表1数据可知, 介孔平均孔径(dBJH)均在4.4~4.6 nm范围内, 且其平均孔径(dave)变化不大, 说明金属Pt和Fe的负载对载体S-1孔道结构影响较小.
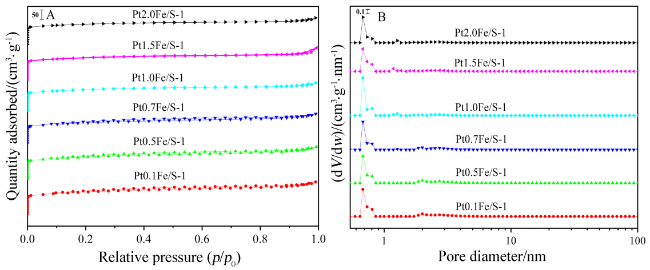
图2 焙烧后PtFe/S-1催化剂的(A) N2-吸附脱附等温线及(B)孔径分布图Figure 2 (A) N2 adsorption-desorption isotherms and (B) pore size distribution of the calcined PtFe/S-1 catalysts |
表1 PtFe/S-1催化剂的织构性能参数Table 1 Textural properties of PtFe/S-1 catalysts |
| Sample | Smica/(m2•g⁻1) | SBETb/(m2•g⁻1) | davec/nm | dBJHd/nm | Vmice/(cm3•g⁻1) | Vt f/(cm3•g⁻1) |
|---|---|---|---|---|---|---|
| Pt0.1Fe/S-1 | 221.5 | 434.5 | 2.4 | 4.4 | 0.11 | 0.26 |
| Pt0.5Fe/S-1 | 208.4 | 423.5 | 2.4 | 4.5 | 0.11 | 0.25 |
| Pt0.7Fe/S-1 | 206.0 | 407.3 | 2.4 | 4.5 | 0.11 | 0.24 |
| Pt1.0Fe/S-1 | 251.5 | 376.3 | 2.3 | 4.4 | 0.13 | 0.22 |
| Pt1.5Fe/S-1 | 260.3 | 392.5 | 2.3 | 4.5 | 0.13 | 0.23 |
| Pt2.0Fe/S-1 | 248.4 | 366.9 | 2.3 | 4.6 | 0.13 | 0.21 |
a Calculated by the t-Plot method; b BET Surface area; c Average pore diameter (4V/A by BET); d Average pore diameter was calculated using the BJH method; e t-Plot micropore volume; f Single point adsorption total pore volume of pores with diameter<40.31 nm at p/p0=0.95. |
结合表1中织构参数数据, 微孔比表面积(Smic)和微孔体积(Vmic)呈现协同变化趋势. 低Fe负载量(≤0.7% (w))催化剂上, Smic从221.5 m2•g⁻1逐渐降至206.0 m2•g⁻1, Vmic保持在0.11 cm3•g⁻1, 这种下降可能是由于高分散Fe物种部分占据微孔所致[22]. 当Fe负载量≥1.0% (w)时, Smic回升至250 m2•g⁻1以上, Vmic增至0.13 cm3•g⁻1, 可能是由于高载量时Fe物种由高分散向聚合状态转变, 从而减轻对微孔的堵塞效应, 使微孔比表面积及孔体积增 加[23]. 而总比表面积(SBET)和总孔体积(Vt)整体随Fe负载量增加呈下降趋势, 分别从434.5 m2•g⁻1和0.26 cm3•g⁻1降至366.9 m2•g⁻1和0.21 cm3•g⁻1. 这种下降趋势与金属负载的稀释效应一致, 即随着金属负载量的增加, 单位质量催化剂中载体的相对含量降低, 导致比表面积和孔体积的表观下降. 值得注意的是, XRD表征结果(图1)显示载体的MFI结构保持完整, 进一步证实了织构参数的变化主要源于金属物种的引入而非载体结构的破坏.
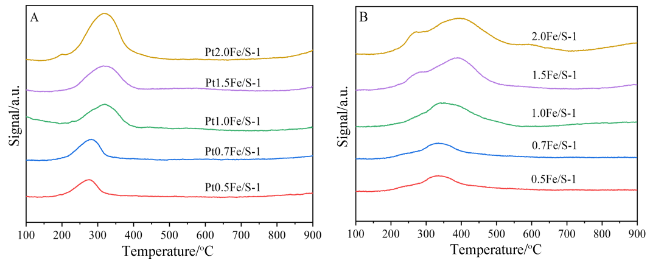
2.3 氢气程序升温还原(H2-TPR)表征结果及分析
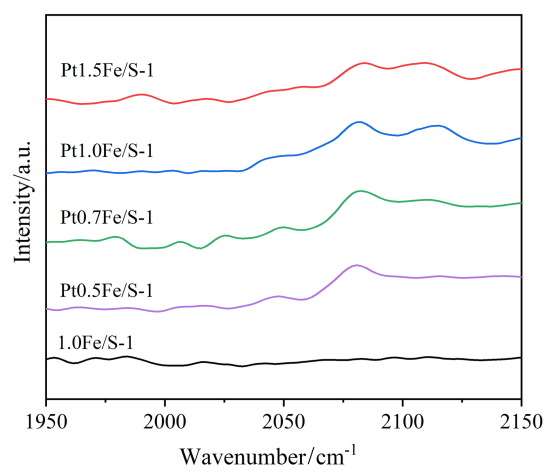
2.4 Raman表征结果及分析
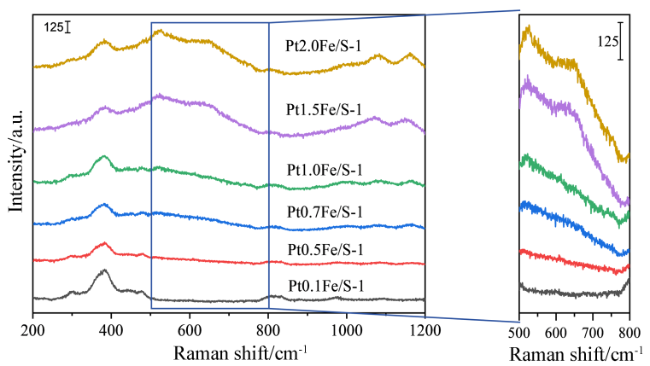
还原后的PtFe/S-1催化剂的拉曼光谱如图4所示. 可以看出, PtFe/S-1样品在380.7和808 cm⁻1处显示出MFI型分子筛的典型振动带[26]. 在980 cm⁻1附近出现的特征峰来自表面Si—OH的振动[27]. PtFe/S-1催化剂样品中未发现归属于Pt物种的特征振动峰, 这表明Pt物种以金属态存在. 525.3、1078.7和1163.6 cm⁻1处的峰归因于骨架四面体Fe物种的振动[28]. 值得注意的是, 仅在Pt1.5Fe/S-1与Pt2.0Fe/S-1催化剂于654 cm⁻1处观察到明显的拉曼特征峰, 该峰归属于Fe3O4中Fe—O键的伸缩振动[29], 表明Fe载量突破分散阈值后, 聚集的Fe物种形成了Fe3O4微晶.
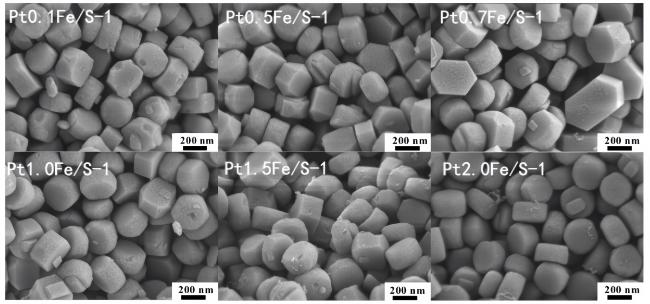
2.5 扫描电子显微镜(SEM)表征结果及分析
通过SEM对PtFe/S-1催化剂的形貌进行了观察, 如图5所示. 所有催化剂均呈现出均匀的“柱状”聚集体, 由于铂的负载量较低, 无法观察到负载的铂颗粒, 铂以小粒径高度分散在载体中, 无明显聚集颗粒. 随着铁负载量的增加, PtFe/S-1催化剂的形貌未发生显著变化, 这表明金属铁和铂高度分散在载体表面, 且未破坏S-1载体的形貌.
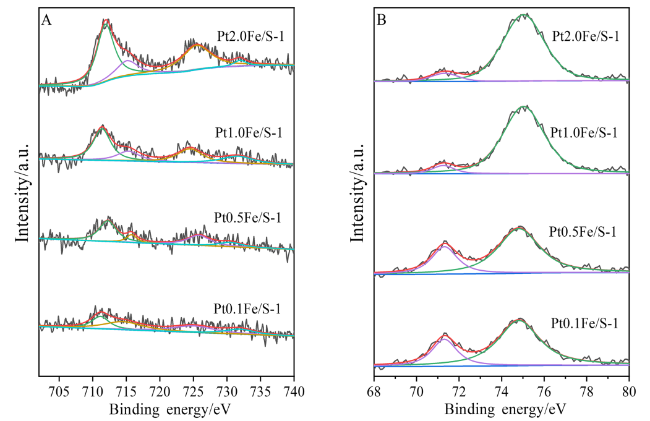
2.6 X射线光电子能谱(XPS)表征结果及分析
PtFe/S-1催化剂中铁物种的化学状态可通过解析Fe 2p区域的XPS谱图确定, 如图6所示. 所有催化剂中, 均可观察到在结合能711.4 eV处存在Fe 2p3/2特征峰, 对应的Fe 2p1/2峰出现在724.3 eV位置. 这两个峰的位置与Fe³⁺的特征结合能高度吻合, 且二者能量差为12.9 eV (724.3~711.4), 与Fe3⁺的理论间距(约13 eV)一致, 表明样品中主要存在Fe3⁺物种[30]. 同时, 在717.2 eV (Fe 2p3/2)和732.2 eV (Fe 2p1/2)处观察到的卫星峰, 其中Fe 2p3/2卫星峰与主峰间距为5.8 eV, Fe 2p1/2卫星峰与主峰间距为7.8 eV, 其间距及强度符合Fe3⁺高自旋态的典型特征[31], 进一步佐证了Fe3⁺的主导地位. 值得注意的是, Fe 2p3/2主峰的半峰宽均超过2.3 eV, 显著宽于纯Fe3⁺物种的理论值(1.8~2.2 eV), 这一现象可归因于Fe2⁺的Fe 2p3/2特征峰(通常位于709.5~710.5 eV)与Fe3⁺主峰的叠加效应[32], 暗示样品中同时存在少量Fe2⁺, 尽管Fe³⁺仍是主要价态, 但半峰宽的异常增大为Fe2⁺的存在提供了有力证据. 此外, 对比不同铁含量催化剂的谱图可见, 随铁负载量增加, Fe 2p3/2与Fe 2p1/2峰的强度逐步增强, 反映出催化剂表面铁物种含量随铁负载量增加而增多的规律.
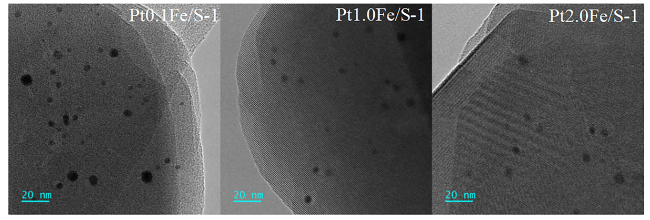
2.7 透射电子显微镜(TEM)表征结果及分析
为了研究PtFe/S-1催化剂中Pt物种的分散情况, 对样品进行了TEM表征. 图7依次显示了Pt0.1Fe/S-1、Pt1.0Fe/S-1和Pt2.0Fe/S-1催化剂的TEM照片. 可以看出S-1载体有序的微孔结构并且在S-1载体上出现了一些纳米颗粒, 可能属于Pt纳米颗粒, Fe物种可能均匀分布在S-1载体孔道中. 与Pt0.1Fe/S-1催化剂相比, Pt1.0Fe/S-1和Pt2.0Fe/S-1催化剂上的Pt颗粒粒径更小, 分布更均匀. 说明Fe的加入增强了Pt与载体间相互作用, 有利于Pt分散度的提高, 从而使Pt以均匀的小颗粒形式存在.
2.8 一氧化碳漫反射傅里叶变换红外光谱(CO-DRIFT)表征结果及分析
2.9 PtFe/S-1催化剂的丙烷脱氢活性评价结果及分析
结合图9A, 9B与表2数据, 1.0Fe/S-1催化剂初始丙烷转化率仅为3.5%, 6 h后降至3.0%, 且初始丙烯选择性为73.2%, 失活速率常数为0.0267 h⁻1. 说明0.1Fe/S-1催化剂几乎不具有活化丙烷C—H键能力, 不能单独以活性组分形式存在. 对于PtFe/S-1催化剂, 低Fe负载量的Pt0.1Fe/S-1催化剂初始丙烷转化率仅为20.9%, 且随反应进行快速失活, 6 h后丙烷转化率骤降至2.9%, 其丙烯选择性从92.6%降至59.2%, 可能因积碳或活性位点结构改变导致催化剂快速失活. 随着Fe负载量的增加, 在Pt0.5Fe/S-1催化剂上初始丙烷转化率提升至48.5%, 6 h后转化率降至12.6%, 失活速率常数为0.313 h⁻1, 说明催化剂发生了明显的失活. 表明Fe含量不足时难以有效抑制催化剂失活. Pt0.7Fe/S-1催化剂初始转化率为55.7%, 6 h后仍保持35.1%, 失活速率常数降至0.141 h⁻1, 且该催化剂的活化能最低, 表明其C—H键活化能力最强. 进一步提高Fe负载量时, Pt1.0Fe/S-1、Pt1.5Fe/S-1和Pt2.0Fe/S-1催化剂上初始丙烷转化率差别不大, 分别为59.8%、59.0%和59.9%, 且失活速率常数随Fe含量增加而降低, 表明适量Fe可通过电子或结构效应稳定活性位点, 或者抑制积碳生成. 在丙烯选择性方面, 低Fe负载量的Pt0.1Fe/S-1催化剂初始丙烯选择性虽高达92.6%, 但随反应进行急剧下降至59.2%, 可能因Pt颗粒团聚或积碳沉积导致催化剂失活. Pt0.5Fe/S-1催化剂初始丙烯选择性为93.6%, 且在反应初期逐渐升高, 但随着反应进行, 催化剂快速失活, 丙烯选择性出现下降趋势. 而其他催化剂上, 随着Fe负载量增加初始丙烯选择性呈下降趋势, 可能是由于过量Fe在载体表面形成FeOx聚集态, 这些聚集Fe物种一方面会部分覆盖Pt活性位, 另一方面聚合的FeOx物种促进了副反应的发生, 使丙烯选择性降低; 且随着反应的进行, 丙烯选择性逐渐升高, 可能是积碳覆盖了副反应发生的活性位, 导致副反应被抑制. 综合来看, Pt1.0Fe/S-1催化剂虽初始丙烷转化率非最高(59.8%), 但6 h反应后仍保持在52.9%, 且丙烯选择性从89.1%提升至96.4%, 综合性能最优, 表明适量Fe负载(1.0% (w))通过调控Pt电子性质及几何结构, 显著提升催化剂的丙烷脱氢活性及稳定性.

图9 1.0Fe/S-1和PtFe/S-1催化剂上(A)丙烷转化率和(B)丙烯选择性随时间变化关系图; (C) PtFe/S-1催化剂的活化能Figure 9 The relationship between (A) propane conversion and (B) propylene selectivity over time during propane dehydrogenation over 1.0Fe/S-1 and PtFe/S-1 catalysts; (C) Activation energy of PtFe/S-1 catalysts |
表2 PtFe/S-1和1.0Fe/S-1催化剂的丙烷脱氢性能Table 2 Propane dehydrogenation performance of PtFe/S-1 and 1.0Fe/S-1 catalysts |
| Sample | Propane conversion/% | Propylene selectivity/% | kd/h⁻1 | |||
|---|---|---|---|---|---|---|
| Initial | Final | Initial | Final | |||
| Pt0.1Fe/S-1 Pt0.5Fe/S-1 Pt0.7Fe/S-1 Pt1.0Fe/S-1 Pt1.5Fe/S-1 Pt2.0Fe/S-1 1.0Fe/S-1 | 20.9 48.5 55.7 59.8 59.0 59.9 3.5 | 2.9 12.6 35.1 52.9 55.3 56.2 3.0 | 92.6 93.6 93.7 89.1 89.4 85.6 73.2 | 59.2 94.3 96.9 96.4 95.1 94.7 73.0 | 0.363 0.313 0.141 0.046 0.025 0.025 0.027 | |
由图9C所示, 当Fe负载量为0.1% (w)时, Pt0.1Fe/S-1催化剂上丙烷脱氢反应活化能高达95.4 kJ/mol, 说明低载量Fe的加入对Pt的修饰能力有限, Pt活性位对丙烷C—H键活化能力较弱; 增加Fe的负载量至0.7% (w)时, Pt0.7Fe/S-1催化剂上丙烷脱氢反应活化能最低, 为55.0 kJ/mol, 说明其活化丙烷C—H键能力增强; 结合丙烷脱氢反应稳定性评价可知, 虽然与Pt0.1Fe/S-1和Pt0.5Fe/S-1催化剂相比, 该催化剂失活速率常数有所降低, 但其稳定性仍较差; 而继续增加Fe负载量至1.0% (w), Pt1.0Fe/S-1催化剂上丙烷脱氢反应活化能略有升高, 为58.8 kJ/mol, 同时该催化剂具有较低的失活速率常数, 说明该催化剂既能高效活化丙烷C—H键, 同时可以维持其高稳定性. 进一步增加Fe负载量, 催化剂的丙烷脱氢反应活化能上升, 且丙烯选择性降低, 说明催化剂对于丙烷C—H键的选择性活化能力下降.
通过上述分析, 并结合表征结果可知, 适量Fe的加入增强了载体S-1与活性组分Pt的相互作用, 提高了Pt的分散度, 同时Fe的给电子作用调控了Pt的电子结构, 使PtFe/S-1催化剂的丙烷脱氢活性提高.
2.10 热重分析(TG)表征结果及分析
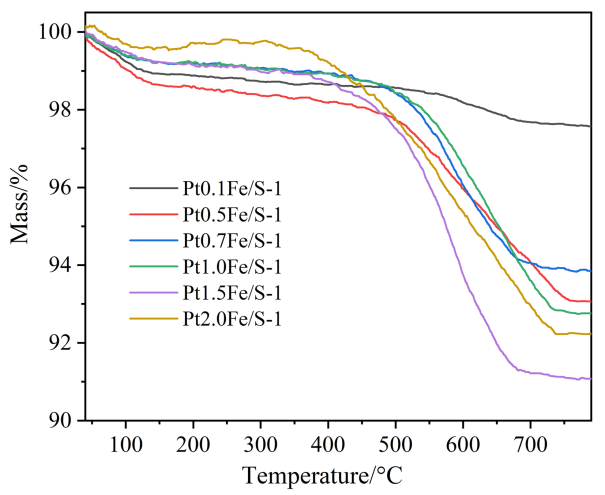
为探究积碳对丙烷脱氢催化性能的影响, 采用热重表征分析了催化剂经6 h反应后的积碳量变化(图10). 其中150 ℃以下的质量损失主要归因于水等小分子的脱除, 而200~800 ℃区间的质量损失则对应于积碳的氧化过程[34-35]. 由图10可知, 随着Fe负载量增加, 积碳呈先增加后降低趋势, 其中Pt0.1Fe/S-1催化剂上质量损失最少, 结合其丙烷转化率低(20.9%)的结果, 表明该催化剂上Pt活性位点活化C—H键能力不足, 既难以驱动目标反应, 也无法通过副反应消耗反应物, 因此其积碳量最低. 而1.5Fe/S-1催化剂上质量损失最大, 说明该催化剂上积碳量最高, 这与其丙烯选择性较低的现象一致, 印证副反应导致的积碳沉积是选择性下降的原因之一. 而Pt2.0Fe/S-1催化剂在150~350 ℃出现质量增加, 可能是由于Fe物种的氧化导致.
综上, 适量Fe (1.0% (w))的加入可以提高Pt的分散度, 且Fe的给电子能力提高了Pt的电子云密度, 有利于产物丙烯脱附, 降低积碳等副反应的发生, 从而提高其丙烷脱氢性能.
3 结论
本研究采用共浸渍法制备了不同Fe负载量的PtFe/Silicalite-1催化剂, 系统表征发现Fe的引入未破坏载体的MFI拓扑结构, Fe物种主要以Fe3+形式存在, 由于Fe与Pt存在强相互作用使得Pt物种高度分散. Fe负载量对丙烷脱氢性能影响显著, 其中Pt1.0Fe/S-1催化剂综合性能最优, 初始丙烷转化率59.8%, 6 h后仍保持52.9%, 丙烯选择性从89.1%提升至96.4%, 说明适量Fe (1.0% (w))的加入可提高Pt的分散度、调控Pt电子性质, 实现催化活性与稳定性的平衡, 为高效丙烷脱氢催化剂的设计提供了参考.
4 实验部分
4.1 试剂与仪器
四丙基氢氧化铵(TPAOH, 质量分数25%), 分析纯, 国药集团试剂有限公司; 正硅酸四乙酯(C8H20O4Si), 分析纯, 国药集团试剂有限公司; 六水合氯铂酸(H2PtCl6•6H2O), 分析纯, 国药集团试剂有限公司; 氯化铁(FeCl3), 分析纯, 国药集团试剂有限公司; 去离子水(H2O), 自制.
HPWF-51型低碳烷烃无氧脱氢反应评价装置, 南京皓而普分析设备有限公司; SPB-3型全自动空气源, 北京中惠普分析技术研究所; DHG-9076A型恒温鼓风干燥箱, 上海精宏实验设备有限公司; ATY124型电子天平, 岛津菲律宾工厂; SX2-5-12TP型马弗炉, 济南精锐分析仪器有限公司; KQ-300DE型超声清洗器, 昆山市舒美超声仪器有限公司; DF-101S型集热式恒温加热搅拌器, 巩义市予华仪器有限责任公司.
4.2 催化剂的制备
采用水热法制备S-1分子筛载体. 具体步骤如下: 在100 mL烧杯中, 量取25.4 mL去离子水、14 mL四丙基氢氧化铵(TPAOH)和15.3 mL正硅酸四乙酯(TEOS), 将三种溶液混合后, 在室温条件下进行强力搅拌, 持续8 h, 形成均匀稳定的凝胶前驱体. 随后将其转移至100 mL聚四氟乙烯内衬的不锈钢晶化釜中, 放入170 ℃的恒温鼓风干燥箱进行水热晶化处理, 晶化过程持续3 d. 晶化结束后, 待晶化釜自然冷却至室温, 通过多次离心分离和去离子水洗涤操作, 彻底去除残留的离子杂质, 随后将样品置于80 ℃下干燥12 h. 最后, 将干燥后的样品转移至马弗炉内, 在550 ℃静态空气氛围下焙烧4 h得到S-1分子筛载体.
在获得S-1分子筛载体后, 以三氯化铁和氯铂酸为活性组分前驱体, 采用共浸渍法制备PtFe/S-1催化剂. 设定铁的负载量分别为0.1%、0.5%、0.7%、1.0%、1.5%、2.0% (w), 铂的负载量为0.5% (w). 采用等体积浸渍法, 将精确配制的氯铂酸与三氯化铁混合溶液均匀加入到S-1载体中. 为确保活性组分前驱体溶液在载体表面及孔道内充分分散, 对样品进行60 min超声处理. 超声结束后, 将样品置于80 ℃环境下烘干, 待样品干燥完全后, 对其进行研磨处理, 使颗粒均匀, 最后将样品放入500 ℃的马弗炉中焙烧400 min形成稳定的PtFe/S-1催化剂.
4.3 催化剂的表征
采用XRD鉴定样品的晶相, 入射光源为Cu Kα辐射, 管电压和管电流值分别保持在40 kV和40 mA, 扫描范围5°~60°, 扫描速率5 (°)•min⁻1. 采用美国MICROMERITICS公司的ASAP 2460型物理吸附仪进行比表面积和孔径的分析表征. 测试之前将0.1 g样品在300 ℃条件下预处理3 h, 除去部分杂质, 之后以N2为吸附质进行静态吸附分析测试. 采用天津先权仪器有限公司5076型化学吸附仪进行H2-TPR测试. 将0.1 g样品装入石英管中, 在300 ℃的Ar气氛下预处理1 h. 冷却至室温后, 切换为10% (ϕ) H2-Ar混合气, 以10 ℃• min⁻1的升温速率加热至900 ℃, 通过热导检测器(TCD)记录氢消耗信号. 采用HORIBA公司LabRAM HR Evolution型拉曼光谱仪进行Raman表征. 将少量样品均匀分散于载玻片上, 采用532 nm激光器在400~1800 cm⁻1范围内采集光谱信号. 采用德国ZEISS公司GeminiSEM 300型扫描电子显微镜进行SEM表征. 取微量样品直接粘附于导电胶上, 使用Quorum SC7620型溅射镀膜仪在10 mA电流条件下喷金处理45 s, 随后在3 kV加速电压下观察并拍摄样品形貌. 采用日立SU8010N场发射扫描电子显微镜观察样品形貌. 采用VG Multilab 2000型X射线光电子能谱仪进行XPS表征, 以分析催化剂表面元素组成及金属原子价态. 测试选用Mg Kα射线源, 以C 1s结合能284.8 eV为内标进行荷电校正. 采用THERMO FEI TALOS F200X透射电子显微镜观察催化剂微观结构. 将样品分散于乙醇溶液中超声处理, 取少量悬浊液滴加至铜网, 待溶剂挥发后进行TEM表征. 采用布鲁克Vertex 80V型傅里叶变换红外光谱仪进行CO-DRIFT表征. 催化剂在300 ℃的10% (ϕ) H2-Ar混合气氛中还原1 h后, 在Ar气氛中降温至50 ℃, 待气氛稳定后切换至CO气氛进行原位红外光谱测试. 采用德国NETZSCH公司生产的STA449F5型热重分析仪进行积碳分析. 分析条件为以氧气为吹扫气氮气为保护气, 测试的最高温度为800 ℃, 升温速率为10 ℃•min⁻1.
4.4 催化剂的评价
丙烷脱氢性能在微型催化反应装置上进行评价, 使用安捷伦气相色谱仪(7890B)进行在线分析. 将0.1g催化剂样品装填至装置中, 在活性评价前, 先于600 ℃、10% H2-Ar混合气氛下还原4 h; 还原后, 在590 ℃条件下开展6 h的丙烷脱氢活性测试, 测试时反应气为丙烷和氮气的混合气(丙烷与氮气体积比为1∶2), 总流量控制为12 mL•min⁻1(其中C3H8流量4 mL•min⁻1, N2流量8 mL•min⁻1), 反应后的产物通过气相色谱仪实时在线分析.
(Cheng, B.)