



1 Introduction
2 Reaction Mechanism and Influencing Factors of eNO3RR under Neutral Conditions
2.1 Reaction Mechanism and Pathways under Neutral Conditions
2.2 Key Influencing Factors Governing Neutral eNO3RR
2.3 Effects of pH on Selectivity, Faradaic Efficiency, and Catalyst Stability
2.4 Comparative Analysis of Acidic, Neutral, and Alkaline Conditions
2.4.1 Acidic Conditions
2.4.2 Alkaline Conditions
2.4.3 Neutral Conditions
2.5 Theoretical Insights from DFT Calculations in eNO3RR
2.5.1 Elucidating Reaction Pathways and Rate-Determining Steps
2.5.2 Establishing Activity Descriptors for Catalyst Screening
2.5.3 Understanding pH-Dependent Reaction Energetics
2.5.4 Guiding Rational Design of Ligand and Metal-Node Engineering
2.6 Evaluation Framework for eNO3RR Catalysts
3 Catalytic Performance and Design Strategies of MOFs in Neutral eNO3RR
3.1 Single-Metal MOF Catalysts
3.1.1 Single-Atom Anchoring
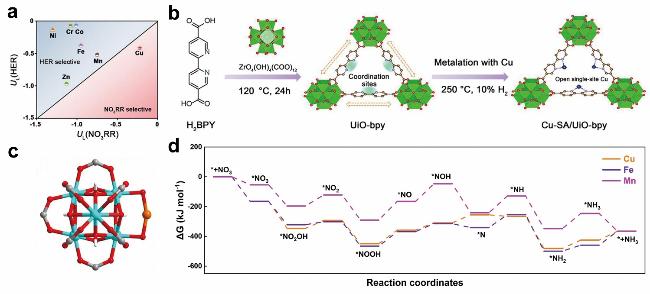
Figure 2 (a) Limiting potentials for NO3RR and HER illustrating the NO3RR selectivity of TM-SAs/UiO-bpy. (b) Schematic illustration of the synthesis of Cu-SA/UiO-bpy samples. Reproduced with permission,[59] Copyright 2025, Wiley-VCH. (c) View of the structure of the cluster node in UiO-66-Cu incorporating a single Cu(II) center at the defect site. Color scheme: Cu, orange; O, red; C, grey; H, white. (d) Gibbs free energy diagram of reaction coordinates for conversion of NO3− to NH3 over Cu-, Fe- and Mn-SAC. Reproduced with permission,[88] Copyright 2024, Springer |
3.1.2 Metal Cluster Design
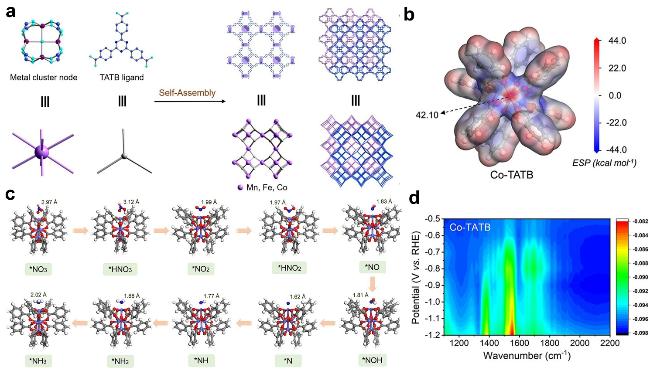
Figure 3 (a) Synthesis Strategy of M-TATB. (b) ESP surface of the Co-TATB model. (c) Optimized adsorption configurations of various reaction intermediates for Co-TATB along the N-terminal pathway. (d) Contour mapping of in situ electrochemical ATR-FTIR spectra of the Co-TATB electrode across a range of applied potentials. Reproduced with permission,[89] Copyright 2025, American Chemical Society |
3.1.3 Functionalization Modification
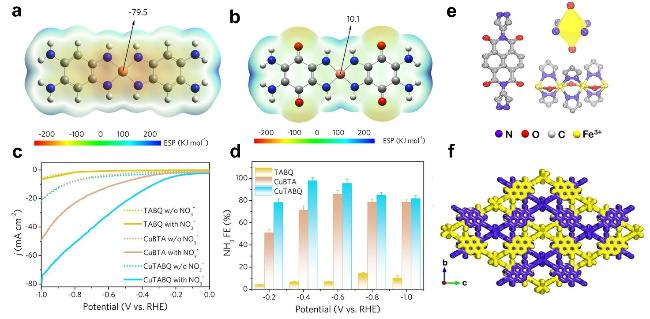
Figure 4 The ESP for (a) CuBTA and (b) CuTABQ. (c) LSV curves of different catalysts in 0.5 mol•L−1 K2SO4 with and without 50 mmol•L−1 NO3−. (d) FEs of CuBTA, CuBTAQ and ligands. Reproduced with permission [99], Copyright 2023, Wiley-VCH. (e) The coordination geometry of Fe3+ and the chain-type Fe-pyrazole metal cluster. (f) Two-fold interpenetrated Fe-pyNDI. Reproduced with permission [100], Copyright 2024, Wiley-VCH |
3.1.4 Structural Regulation
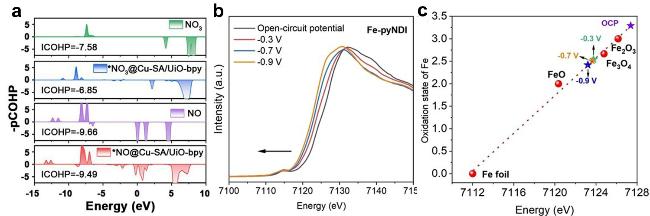
Figure 5 (a) Projected crystal orbital Hamilton population (pCOHP) of NO3 and NO before and after adsorption on Cu-SA/UiO-bpy, respectively. Reproduced with permission,[59] Copyright 2025, Wiley-VCH. (b) Fe K-edge XANES spectra of Fe-pyNDI at different potentials. (c) The variation curve of the average Fe oxidation state with potential derived from XANES data fitting. Reproduced with permission.[100] Copyright 2024, Wiley-VCH |
3.2 Bimetallic/Multimetallic MOF Catalysts
3.2.1 Bimetallic Node Synergy
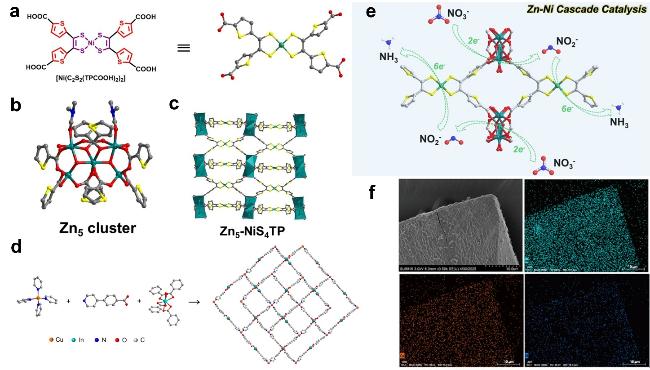
Figure 6 Crystal structure of the ligand (a), view of (b) Zn5 cluster and the (c) network of Zn5-NiS4TP. (d) The concept of the catalytic mechanism of eNO3RR by Zn5-NiS4TP. Reproduced with permission,[47] Copyright 2024, Wiley-VCH. (e) Structure of Cu node, In node, and crystal structure for InCu-MOF. (f) EDS mapping of InCu-MOF: Cu (orange), In (cyan), and N (blue). Reproduced with permission,[108] Copyright 2025, Tsinghua University Press |
3.2.2 Metal Cluster/Nanoparticle Embedding
3.2.3 Heterogeneous Single-Atom Doping for Synergistic Site Construction
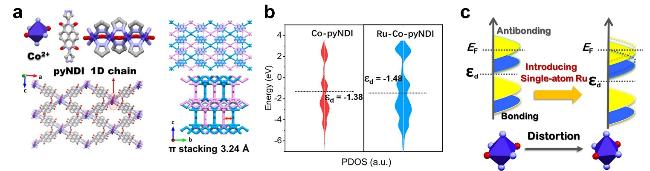
Table 1 Summary of reported pristine MOFs electrocatalysts for eNO3RR in recent years |
| Electrocatalyst | Electrolyte | NH3 yield | NH3 Selectivity | FENH3 | Optimal potentials | Stability | Ref. |
|---|---|---|---|---|---|---|---|
| Cu-BDC | 0.5 mol•L−1 Na2SO4 + 0.05 mol•L−1 NaNO3 | 130.16 μmol•h−1•cm−2 | — | 67.42% | −0.946 V | 5 r | [84] |
| Zn-MOF | 0.1 mol•L−1 Na2SO4 + 500 ppm KNO3 | 461.1 μmol•h−1•mgcat−1 | — | 80.50% | −1.1 V | 10 r | [81] |
| Zn5-NiS4TP MOF | 0.05 mol•L−1 K2SO4 + 0.5 mol•L−1 KNO3 | 1378.52 μmol•h−1•mgcat−1 | 96.20% | 92.87% | −1.3 V | 20 r | [47] |
| InCu-MOF | 0.5 mol•L−1 K2SO4 + 300 ppm KNO3 | 52.37 μmol•h−1•mgcat−1 | — | 82% | −1.0 V | 5 r | [108] |
| Co-TATB | 0.1 mol•L−1 Na2SO4 + 0.1 mol•L−1 KNO3 | 378.8 mmol•h−1•gcat−1 | — | 98% | −1.0 V | 8 r | [89] |
| Co-bpta-btc | 0.05 mol•L−1 Na2SO4 + 0.1 mol•L−1 KNO3 | 604.78 μmol•h−1•mgcat−1 | — | 83.3% | −1.0 V | 12 h | [114] |
| HUST-38 | 0.5 mol•L−1 K2SO4 + 0.1 mol•L−1 NO3- | 785.63 μmol•h−1•mgcat−1 | 92.7% | 95.7% | −0.6 V | 96 h | [44] |
| agCu(Melm)2-CC | 0.5 mol•L−1 K2SO4 + 75 mmol•L−1 KNO3 | 1.20 mmol•h−1•cm−2 | — | 91% | −1.8 V | 16 h | [115] |
| DiMe-Cu3-MOF | 0.5 mol•L−1 K2SO4 + 50 mmol•L−1 KNO3 | 23.54 μmol•h−1•cm−2 | — | 95% | −1.55 V | 12 h | [95] |
| Fe-pyNDI | 0.5 mol•L−1 K2SO4 + 0.1 mol•L−1 KNO3 | 861.78 μmol•h−1•mgcat−1 | — | ≈90% | −1.2 V | 10 r | [100] |
| Cu-CA | 0.1 mol•L−1 Na2SO4 + 0.1 mol•L−1 KNO3 | 186.72 μmol•h−1•mgcat−1 | — | 90.3% | −0.9 V | 10 r | [116] |
| NJUZ-2 | 0.1 mol•L−1 Na2SO4 + 0.1 mol•L−1 KNO3 | 253.7 mmol•h−1•gcat−1 | — | 98.4% | −0.8 V | 70 r | [117] |
| NJUZ-3 | 0.1 mol•L−1 Na2SO4 + 0.1 mol•L−1 KNO3 | 214.5 mmol•h−1•gcat−1 | — | 98.8% | −0.8 V | — | [117] |
| Cu-BTA | 0.5 mol•L−1 Na2SO4 + 100 ppm KNO3 | 133.87 μmol•h−1•cm−2 | 79.46% | — | −1.2 V | 20 r | [118] |
| CuNi0.75-MOF/NF | 0.5 mol•L−1 Na2SO4 + 0.1 mol•L−1 NaNO3 | 3.04 mmol•h−1•cm−2 | — | 95.88% | −1.0 V | 10 r | [74] |
Note: The optimal potentials are all referenced to the Reversible Hydrogen Electrode (RHE). For ease of comparison, the yield data have been converted to molar units (MNH3=17.03 g•mol−1). The number of cycles (r, run) and operation duration (h, hour) are selected based on stability data. |
3.3 Conductive MOF
3.3.1 Intrinsically Conductive MOFs
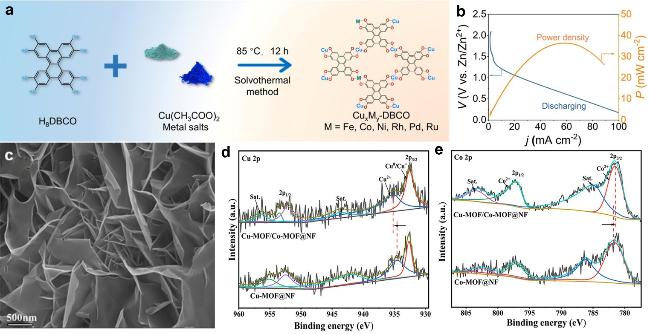
Figure 8 (a) Schematic illustration of the preparation of CuxMy-DBCO MOFs catalysts. (b) Polarization curves and power density of Zn-NO3− batteries composed of Cu98.5Ni1.5-DBCO.[120] Copyright 2025, American Chemical Society. (c) SEM images of Cu-MOF/Co-MOF@NF. (d) Cu 2p spectra of Cu-MOF/Co-MOF@NF compared with Cu-MOF@NF and (e) Co 2p spectra compared with Co-MOF@NF.[126] Copyright 2025, American Chemical Society |
3.3.2 Conductive MOF Composites
3.3.3 Perspectives on the Synergistic Design of Conductive MOFs and MOF-Based Composites
3.4 MOF Composites
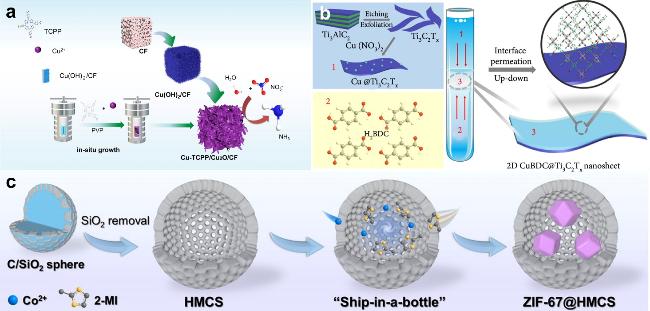
Figure 9 (a) Schematic of the preparation of Cu-TCPP/Cu2O/CF 3D tandem electrode synthesized on CF. Reproduced with permission,[30] Copyright 2025, American Chemical Society. (b) Schematic illustration of the preparation process of the MOF@MXene nanosheets as a flexible electrode via permeation-mediated strategy. Reproduced with permission,[134] Copyright 2022, AAAS. (c) Schematic diagram of the "ship-in-a-bottle" strategy for encapsulating ZIF-67 into HMCS. Reproduced with permission,[135] Copyright 2025, Wiley-VCH |
3.5 MOF Derivatives
3.5.1 Pyrolytic Carbonization
3.5.2 Oxidative Calcination
Table 2 Recently explored MOF composites and MOF-derived catalysts |
| Electrocatalyst | Electrolyte | NH3 yield | NH3 Selectivity | FENH3 | Optimal potentials | Stability | Ref. |
|---|---|---|---|---|---|---|---|
| Cu/SO3-MOF-808 | 0.5 mol•L−1 Na2SO4 + 0.1 mol•L−1 NaNO3 | 0.383 mmol•h−1•mgcat−1 | 95.6% | 87.5% | −1.19 V | — | [153] |
| CoP/Zn-ZIF | 0.5 mol•L−1 Na2SO4 + 0.1 mol•L−1 NaNO3 | 0.9 mmol•h−1•cm−2 | — | ≈97% | −1.0 V | 30 r | [154] |
| Cu3P-a | 0.5 mol•L−1 K2SO4 + 50 ppm KNO3-N | 31.86 μmol•h−1•cm−2 | 83.62% | 90.95% | −0.5 V | 8 r | [155] |
| FeNx-PC-Fe NPs | 0.5 mol•L−1 Na2SO4 + 1.0 mol•L−1 NaNO3 | 1.77 ± 0.06 mmol•h−1•mgcat−1 | — | 93.5% | −1.0 V | 120 h | [156] |
| AuPt@ZIF-8 | 0.5 mol•L−1 Na2SO4 + 50 ppm NaNO3 | 7.72 μmol•h−1•mgcat−1 | 96% | (95.8 ± 3.0)% | −0.5 V | 6 r | [140] |
| Ni-MOFs@HsGDY@Cu | 0.5 mol•L−1 Na2SO4 + 0.1 mol•L−1 KNO3 | 0.321 mmol•h−1•cm−2 | — | 95.5% | −0.11 V | 12 r | [157] |
| CuCeOx/C | 0.5 mol•L−1 Na2SO4 + 0.5 mol•L−1 NaNO3 | — | 73.40% | 75.5% | −1.29 V | 1 h | [158] |
| Cu-Co HOC | 0.5 mol•L−1 K2SO4 + 50 ppm KNO3-N | 0.022 mmol•h−1•cm−2 | — | 90.68% | −0.5 V | — | [152] |
| UiO-CuZn | 0.5 mol•L−1 Na2SO4+ 200 ppm NaNO3 | 228.11 μmol•h−1•mgcat−1 | 95.2% | 92.6% | −1.0 V | — | [159] |
| UiO-66-derived M-SAC | 1 mol•L−1 KNO3 | 1.76 mmol•h−1•cm−2 | — | >96% | −1.0 V | — | [88] |
| Fe-S-Z-C | 0.02 mol•L−1 Na2SO4 + 100 mg•L−1 NO3--N | — | — | 93.9% | −0.47 V | 6 r | [160] |
| Cu-Ru@C | 0.1 mol•L−1 Na2SO4 + 50 μg•mL−1 NaNO3 | 99.84 μmol•h−1•mgcat−1 | 84.70% | 90.4% | −0.9 V | 25 h | [161] |
| Cu-Co3O4/NF | 0.2 mol•L−1 K2SO4 + 2 mmol•L−1 KNO3 | 0.076 mmol•h−1•cm−2 | — | 92.4% | −0.53 V | 6 r | [162] |
| NiPC | 0.5 mol•L−1 Na2SO4 + 200 mg•L−1 KNO3 | 108.04 μmol•h−1•cm−2 | 99.04% | 96.68% | −1.0 V | — | [139] |
| NiCoO2@Cu | 0.1 mol•L−1 Na2SO4 + 0.1 mol•L−1 NaNO3 | 348.82 μmol•h−1•cm−2 | 99.7% | 94.2% | −0.7 V | 33 h | [127] |
| Co-N-C-500 | 0.05 mol•L−1 K2SO4 + 0.05 mol•L−1 KNO3 | 66.93 μmol•h−1•cm−2 | 74% | 86.8% | −0.6 V | 30 h | [149] |
| Co3O4@MoS2 | 0.1 mol•L−1 Na2SO4 + 0.2 mol•L−1 KNO3 | 266.55 μmol•h−1•mgcat−1 | — | 52.69% | −0.64 V | 10 r | [163] |
The optimal potentials are all referenced to the Reversible Hydrogen Electrode (vs. RHE). For ease of comparison, the yield data have been converted to molar units (MNH3=17.03 g•mol−1). The number of cycles (r, run) and operation duration (h, hour) are selected based on stability data. |
3.6 Reactor Engineering for MOF-based eNO3RR
3.6.1 Diffusion Layer Regulation and Mass Transfer Enhancement
3.6.2 Electrode Configuration Optimization
3.6.3 Coupling with Renewable Energy
3.7 Addressing the Challenge of NO2− Accumulation
3.8 Stability Mechanisms and Design Principles of MOFs in Neutral Media
3.8.1 Key Mechanisms of MOF Destabilization
3.8.2 Structure-Stability Relationship and Regulation Strategies
3.9 Dynamic Evolution and Real Active Sites of MOF-based Catalysts
3.9.1 Dynamic Evolution under Electrochemical Conditions
3.9.2 In situ/Operando Characterization Techniques
4 Comparative Assessment with Benchmark Non-MOF Catalysts
4.1 Activity and Stability
Table 3 Performance and efficacy comparison between non-MOF catalysts and MOF-based catalysts in neutral electrolytes |
| Electrocatalyst | Electrolyte | NH3 yield | FENH3 | Optimal potentials | Stability | Cost Evaluation | Ref. |
|---|---|---|---|---|---|---|---|
| Au/Cu SAA | 0.5 mol•L−1 Na2SO4+100 ppm of NO3−−N | 0.193 mmol•h−1•cm−2 | 99.69% | −0.8 V | 45 h | High | [203] |
| Bi/Cu2O | 0.5 mol•L−1 K2SO4+1000 ppm NO3− | 0.150 mmol•h−1•mgcat−1 | 99.2% | −0.8 V | 14 h | Low | [208] |
| Ni1Cu-SAA | 0.5 mol•L−1 K2SO4+200 ppm NO3−−N | 0.326 mmol•h−1•cm−2 | ≈100% | −0.55 V | ≈8.89 h | Medium | [204] |
| Rh@Cu-0.6% | 0.1 mol•L−1 Na2SO4 + 0.1 mol•L−1 KNO3 | 1.27 mmol•h−1•cm−2 | 93 % | −0.2 V | 30 h | High | [206] |
| Fe-N-C | 0.1 mol•L−1 K2SO4 +0.5 mol•L−1 KNO3 | 0.46 mmol•h−1•cm−2 | 75% | −0.66 V | 20 r | Medium | [208] |
| P-Cu0.51Ni0.49 | 0.5 mol•L−1 K2SO4 + 50 ppm KNO3 | 94.94 μmol•h−1•cm−2 | 98.38% | −0.55 V | 10 h | Low | [209] |
| hcp/fcc Cu10Ni₉₀ | 0.5 mol•L−1 K2SO4 + 100 mmol•L−1 KNO3 | 3.37 mmol•h−1•mgcat−1 | 98.1% | −0.7 V | 12 r | Low | [210] |
| Cl-Cu | 0.1 mol•L−1 K2SO4 + 50~200 mg•L−1 NO3−−N | 4.32 μmol•h−1•cm−2 | 82.5% | −0.65 V | >100 h | Low | [207] |
| Cu-SA/UiO-bpy | 0.5 mol•L−1 K2SO4 + 0.1 mol•L−1 KNO3 | 434.5 μmol•h−1•cm−2 | 98.1% | −0.8 V | 10 r | Medium | [59] |
| NJUZ-2 | 0.1 mol•L−1 Na2SO4 + 0.1 mol•L−1 KNO3 | 253.7 mmol•h−1•mgcat−1 | 98.8% | −0.8 V | 70 h | Medium | [117] |
| Zn5-NiS4 TP MOF | 0.05 mol•L−1 K2SO4 + 0.5 mol•L−1 KNO3 | 1.348 mmol•h−1•mgcat−1 | 92.87% | −1.3 V | 20 r | High | [47] |
| FeNx-PC-Fe NPs | 0.5 mol•L−1 Na2SO4 + 1.0 mol•L−1 NaNO3 | 1.77±0.06 mmol•h−1•mgcat−1 | 98.4% | −1 V | 120 h | Medium | [156] |
| CuNi0.75-MOF/NF | 0.5 mol•L−1 Na2SO4 + 0.1 mol•L−1 NaNO3 | 3.04 mmol•h−1•cm−2 | 95.88% | −1 V | 10 r | Low | [74] |
| HUST-38 | 0.5 mol•L−1 K2SO4 + 0.1 mol•L−1 NO3− | 0.785 mmol•h−1•mgcat−1 | 95.7% | −0.6 V | 96 h | Medium | [44] |
The "Cost Evaluation" section is assessed based on the total cost, including synthesis and replacement of the material. For ease of comparison, the yield data have been converted to molar units. (MNH3=17.03 g•mol−1). The number of cycles (r, run) and operation duration (h, hour) are selected based on stability data. |