



1 结果与讨论
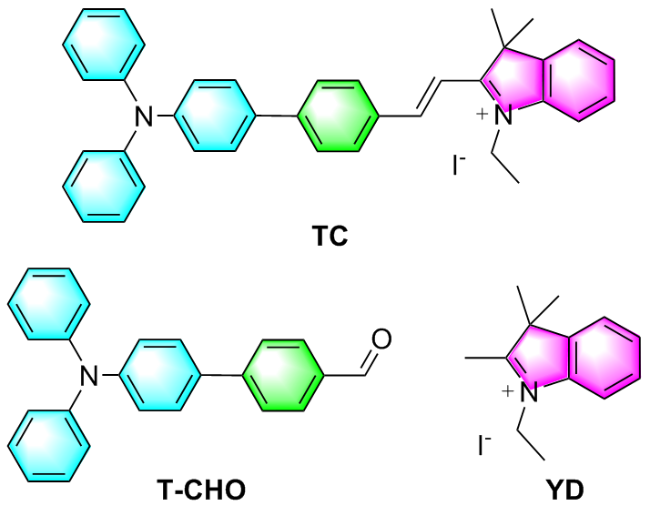
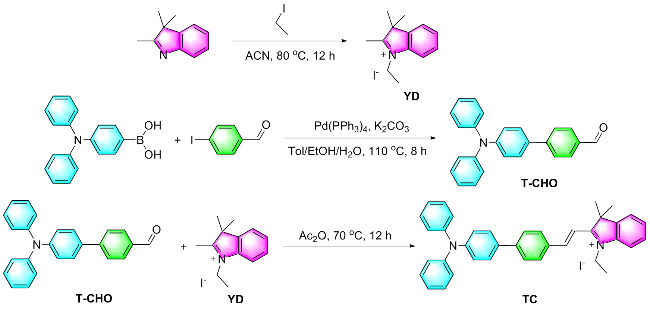
1.1 分子合成与结构表征
1.2 稳态吸收与荧光光谱
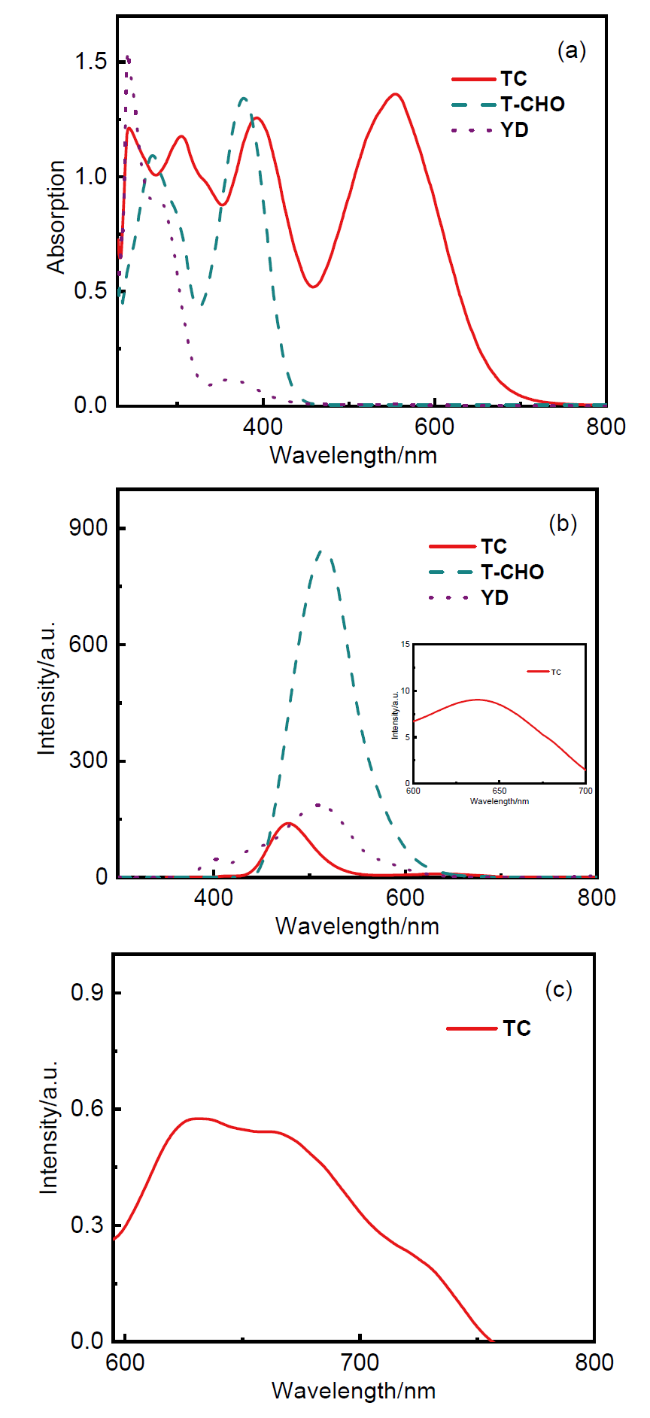
图2 (a)化合物TC、T-CHO和YD在CHCl3中的稳态吸收光谱; (b)化合物TC、T-CHO和YD在CHCl3中的荧光发射光谱(插图为TC在600~700 nm区间内的荧光发射光谱的放大图, 激发波长为400 nm, 浓度1.0×10⁻⁵ mol/L); (c)化合物TC在CHCl3中的荧光发射光谱(激发波长为540 nm, 浓度1.0×10⁻⁵ mol/L)Figure 2 (a) Steady-state absorption spectra of compounds TC, T-CHO, and YD in CHCl3; (b) Fluorescence emission spectra of compounds TC, T-CHO, and YD in CHCl3 (inset showing an enlarged view of the fluorescence emission spectrum of TC in the 600~700 nm range (excitation wavelength: 400 nm, concentration: 1.0×10⁻⁵ mol/L); (c) Fluorescence emission spectrum of compound TC in CHCl3 (excitation wavelength: 540 nm, concentration: 1.0×10⁻⁵ mol/L) |
1.3 瞬态吸收和荧光寿命
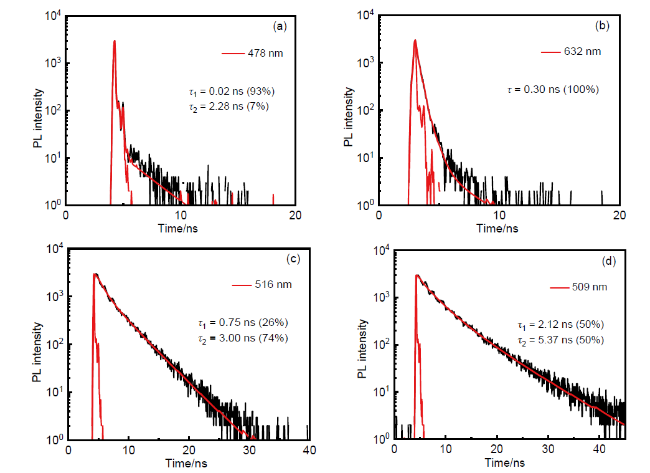
图3 TC (a)、T-CHO (c)和YD (d)在CHCl3中的荧光衰减曲线(激发波长为400 nm, 检测波长分别为478、516和509 nm), 同时给出其对应的双指数拟合结果; (b) TC在CHCl3中的荧光衰减曲线(激发波长为540 nm, 检测波长为632 nm), 并给出其对应的单指数拟合结果Figure 3 Fluorescence decay traces of TC (a), T-CHO (c), and YD (d) obtained by TCSPC in CHCl3 (excited at 400 nm and recorded at 478, 516, and 509 nm, respectively), along with their corresponding biexponential fitting results; (b) Fluorescence decay trace of TC obtained by TCSPC in CHCl3 (excited at 540 nm and recorded at 632 nm), along with its corresponding single-exponential fitting result The red curve, characterized by a narrow half-width at half-maximum and rapid decay, represents the IRF. |
1.4 理论计算
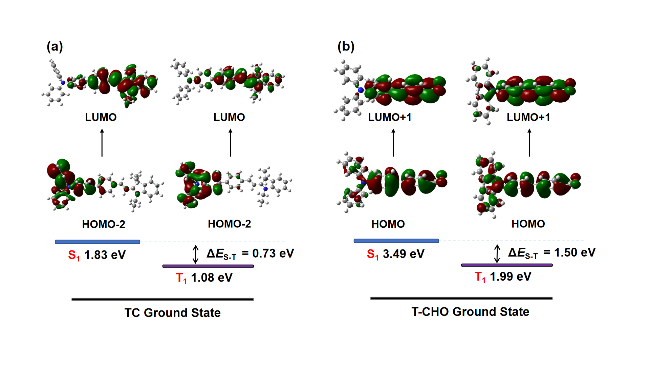
1.5 ROS的研究
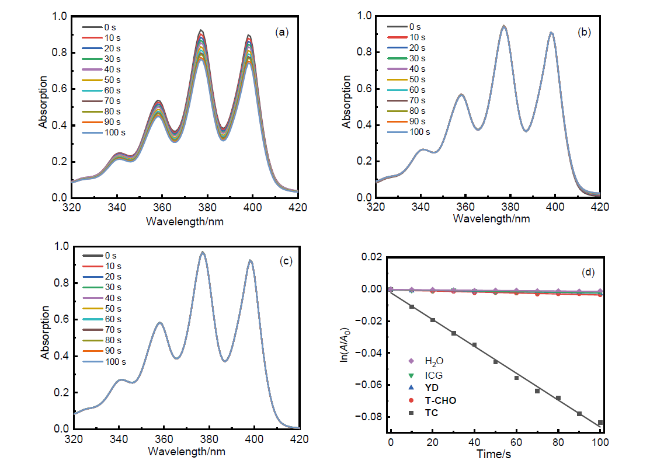
图5 化合物TC (a)、T-CHO (b)和YD (c)作为PSs时ABDA在100 s内受到光照的稳态吸收光谱变化图; (d)通过公式ln(A/A0)对ABDA在377 nm处的吸收变化进行拟合的结果图(测试时PSs的浓度: 1×10⁻⁵ mol/L, ABDA浓度: 1.25×10⁻⁵ mol/L. A和A0为377 nm处的吸收值, 其中A是随着时间变化的吸收值, A0是初始无光照的吸收值, 光通量大小为10 mW/cm2)Figure 5 Steady-state absorption spectra showing the changes in ABDA under illumination for 100 s when compounds TC (a), T-CHO (b), and YD (c) are used as PSs; (d) Fitting plot of the changes in ABDA absorption at 377 nm using the equation ln(A/A0) (the concentration of PSs was 1×10⁻⁵ mol/L and the ABDA concentration was 1.25×10⁻⁵ mol/L. A represents the absorption at 377 nm at different time intervals, A0 is the initial absorption value without illumination, and the light intensity is 10 mW/cm²) |
表1 PSs的(1O2)a的量子产率Table 1 The quantum yield of 1O2 for the PSsa |
| Photosensitizer | kobsb/s-1 | vic | Φ∆d |
|---|---|---|---|
| TC | 1.760 | 0.1760 | 0.766 |
| T-CHO YD | 0.072 0.048 | 0.0072 0.0048 | 0.152 —e |
| ICG | 0.045 | 0.0045 | 0.002 |
a In H2O, c=1.0×10⁻⁵ mol/L. b The rate constant kobs was calculated by the rule: ln(A/A0)=-kobst, in 10-3 s-1. c Initial consumption rate of ABDA, vi=kobs[ABDA], in 10-6 mol•L-1•s-1. d Quantum yield of 1O2, with ICG as standard (Φ∆=0.002 in H2O). e Not determined.[25] |
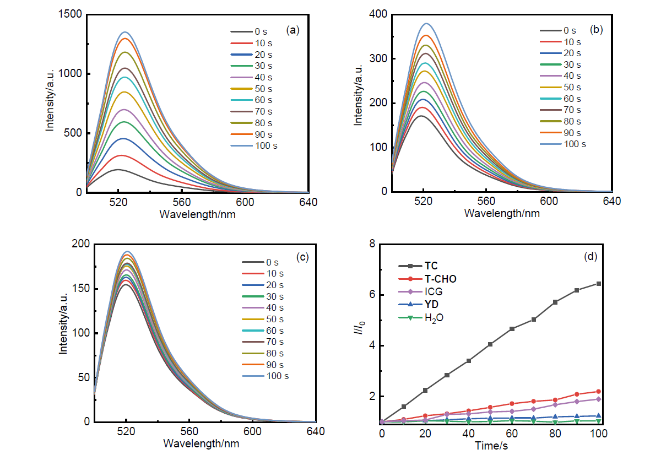
图6 化合物TC (a)、T-CHO (b)和YD (c)作为PSs时DHR123在100 s内受到光照的荧光发射光谱图; (d)通过公式I/I0对DHR123在525 nm处的变化进行拟合图(测试时PSs的浓度: 1×10⁻⁵ mol/L, DHR123浓度: 1×10⁻⁵ mol/L. I和I0为525 nm处的荧光强度, 其中I是随着时间变化的荧光强度, I0是初始没光照的荧光强度, 光通量大小10 mW/cm2)Figure 6 Fluorescence emission spectra of DHR123 under illumination for 100 s when compounds TC (a), T-CHO (b), and YD (c) are used as PSs; (d) Fitting plot of the changes in fluorescence intensity of DHR123 at 525 nm using the equation I/I0 (during testing, the concentration of PSs and DHR123 are both 1×10⁻⁵ mol/L. I represents the fluorescence intensity at 525 nm at different time intervals, I0 is the initial fluorescence intensity without illumination, and the light intensity is 10 mW/cm²) |
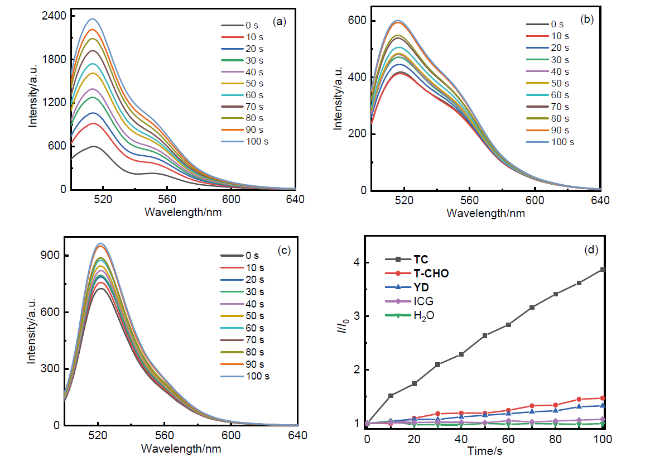
图7 化合物TC (a)、T-CHO (b)和YD (c)作为PSs时HPF在100 s内受到光照的荧光发射光谱图; (d)通过公式I/I0对HPF在515 nm处的变化进行拟合图(测试时PSs的浓度: 1×10⁻⁵ mol/L, HPF浓度: 1×10⁻⁶ mol/L. I和I0为515 nm处的荧光强度, 其中I是随着时间变化的荧光强度, I0是初始没光照的荧光强度, 光通量大小10 mW/cm2)Figure 7 Fluorescence emission spectra of HPF under illumination for 100 s when compounds TC (a), T-CHO (b), and YD (c) are used as PSs; (d) Fitting plot of the changes in fluorescence intensity of HPF at 515 nm using the equation I/I0 (during testing, the concentration of PSs was 1×10⁻⁵ mol/L, with a HPF concentration of 1×10⁻⁶ mol/L. Here, I represents the fluorescence intensity at 515 nm at different time intervals, I0 is the initial fluorescence intensity without illumination, and the light intensity is 10 mW/cm² |
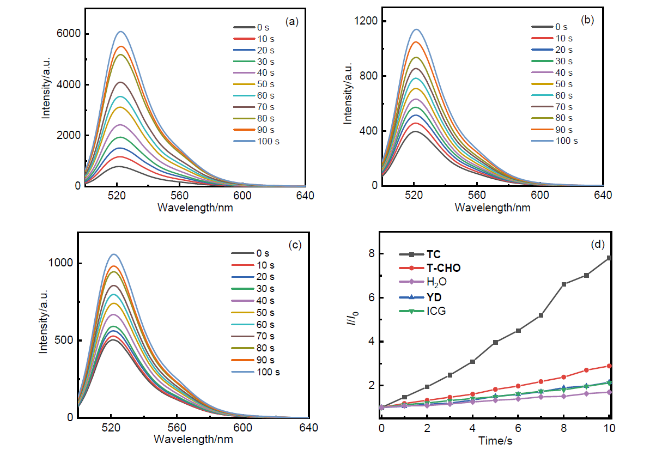


图8 化合物TC (a)、T-CHO (b)和YD (c)作为PSs时DCFH-DA在100 s内受到光照的荧光发射光谱图; (d)通过公式I/I0对DCFH-DA在525 nm处的变化进行拟合图(测试时PSs的浓度: 1×10⁻⁵ mol/L, DCFH-DA浓度: 4×10⁻⁵ mol/L. I和I0为525 nm处的荧光强度, 其中I是随着时间变化的荧光强度, I0是初始没光照的荧光强度, 光通量大小10 mW/cm2)Figure 8 Fluorescence emission spectra of DCFH-DA under illumination for 100 s when compounds TC (a), T-CHO (b), and YD (c) are used as PSs; (d) Fitting plot of the changes in fluorescence intensity of DCFH-DA at 525 nm using the equation I/I0 (during testing, the concentration of PSs was 1×10⁻⁵ mol/L, with an DCFH-DA concentration of 4×10⁻⁵ mol/L. I represents the fluorescence intensity at 525 nm at different time intervals, I0 is the initial fluorescence intensity without illumination, and the light intensity is 10 mW/cm²) |