1 结果与讨论
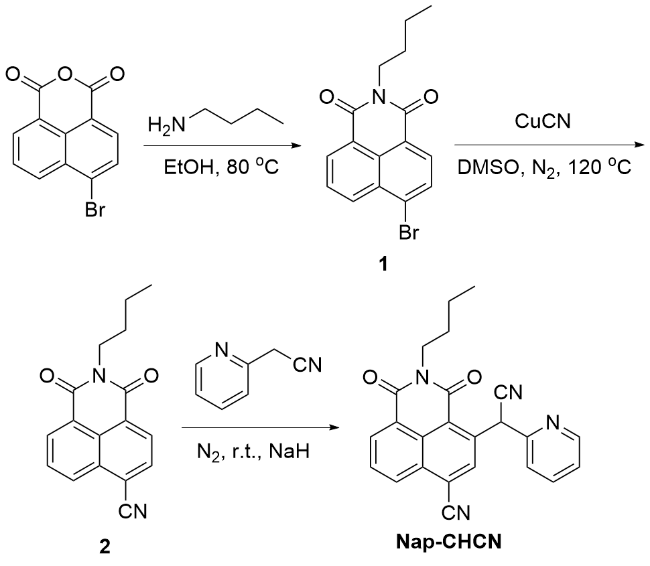
1.1 探针Nap-CHCN的合成路线
1.2 探针Nap-CHCN对氰根离子的紫外-可见吸收光谱性能研究
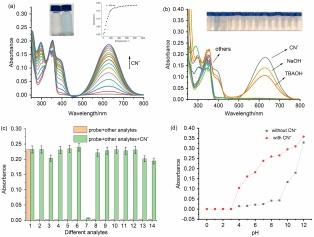
图1 (a)探针Nap-CHCN (20 μmol/L)与CN- (0~42.0 equiv.)在CH3CN/PBS (V∶V=9∶1, pH=7.4)中的紫外滴定光谱图; (b)探针Nap-CHCN (20 μmol/L)与42.0 equiv.不同阴离子(5000 μmol/L)在CH3CN/PBS (V∶V=9∶1, pH=7.4)中的紫外吸收选择性图(插图为日光下探针Nap-CHCN与不同阴离子分析物作用后的溶液颜色变化图); (c)探针Nap-CHCN (20 μmol/L)与各种阴离子分析物在CH3CN/PBS (V∶V=9∶1, pH=7.4)溶液中的干扰性实验结果[采用双柱状图可视化呈现检测结果: 黄色条柱对应单一阴离子饱和浓度(42.0 equiv.)下探针在630 nm处的吸光度变化, 绿色条柱则表示非CN-阴离子共存时额外添加饱和量CN-的干扰效应. 图中标注的数字依次对应以下分析物: (1) CN-, (2) Br-, (3) ClO-, (4) DTT, (5) F-, (6) NaHS, (7) $\mathrm{HSO}_{4}^{-}$, (8) I-, (9) $\mathrm{NO}_{3}^{-}$, (10) $\mathrm{HPO}_{4}^{2-}$, (11) $\mathrm{HCO}_{3}^{-}$, (12) ATP, (13)甘氨酸, (14)亮氨酸]; (d)在不同pH值条件下探针Nap-CHCN (20 μmol/L, 42 equiv. CN-)在CH3CN/PBS (V∶V=9∶1, pH=7.4)体系中于630 nm波长处的紫外吸收光谱变化Figure 1 (a) UV titration spectrum of the probe Nap-CHCN (20 μmol/L) with CN- (0~42.0 equiv.) in CH3CN/PBS solution (V∶V=9∶1, pH=7.4); (b) UV absorption selectivity profile of probe Nap-CHCN (20 μmol/L) in the presence of 42.0 equiv. of various anions (5000 μmol/L each) within a CH3CN/PBS solution (V∶V=9∶1, pH=7.4) [The inset illustrates the color change of the probe Nap-CHCN solution upon interaction with various anionic analytes under natural daylight]; (c) Interference study of the probe Nap-CHCN (20 μmol/L) with various anionic analytes in CH3CN/PBS solution (V∶V=9∶1, pH=7.4) using dual bar graphs [Yellow bars represent the UV absorption intensity (630 nm) of the probe under saturated concentrations (42.0 equiv.) of individual anions, while green bars indicate the combined effect of non-CN- analytes (5000 μmol/L) with additional saturated CN-. The numbered entries in the figure correspond to specific analytes as follows: (1) CN-, (2) Br-, (3) ClO-, (4) DTT, (5) F-, (6) NaHS, (7) $\mathrm{HSO}_{4}^{-}$, (8) I-, (9) $\mathrm{NO}_{3}^{-}$, (10) $\mathrm{HPO}_{4}^{2-}$, (11) $\mathrm{HCO}_{3}^{-}$, (12) ATP, (13) Glycine, and (14) Leucine]; (d) UV absorption spectrum (630 nm) of the probe Nap-CHCN (20 μmol/L, 42 equiv. of CN-) in CH3CN/PBS solution (V∶V=9∶1, pH=7.4) at different pH values |
1.3 探针Nap-CHCN对CN-识别的可逆性实验
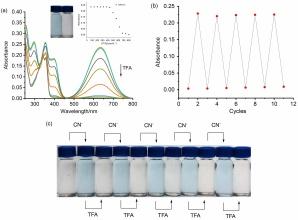
图2 (a)在CH3CN/PBS缓冲液(V∶V=9∶1, pH=7.4)中通过TFA (0~44.0 equiv.)对[Nap-CHCN+CN-]络合物进行紫外-可见滴定(插图显示了在630 nm波长处的吸光度与TFA浓度的关系); (b)在CH3CN中用CN-和H+ (TFA)滴定探针Nap-CHCN的相对紫外-可见吸光度循环性实验; (c)在CH3CN/PBS缓冲液(V∶V=9∶1, pH=7.4)中连续添加CN-和H+ (TFA)后探针Nap-CHCN的颜色变化Figure 2 (a) UV-Vis titration of [Nap-CHCN+CN-] complexes with TFA (0~44.0 equiv.) performed in CH3CN/PBS solution (V∶ V=9∶1, pH=7.4) (The inset demonstrates the linear relationship between the absorbance at 630 nm and the concentration of TFA); (b) Cycling behavior of relative UV-Vis absorbance investigated by titrating the probe Nap-CHCN with CN- and H+ (provided by TFA) in CH3CN solution; (c) Color change of probe Nap-CHCN upon sequential addition of CN- and H+ (TFA) in a CH3CN/PBS solution (V∶V=9∶1, pH=7.4) system |
1.4 探针Nap-CHCN识别氰根离子的机理研究
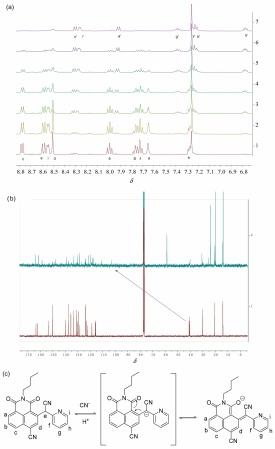
图3 (a)探针Nap-CHCN与CN-在CDCl3中的1H NMR核磁滴定谱图(自下而上: 0, 0.2, 0.4, 0.8, 1.0, 1.5, 1.8 equiv.); (b) Nap-CHCN与CN-在CDCl3中的13C NMR核磁滴定谱图(自下而上: 0, 1.5 equiv.四丁基氰化铵); (c)识别机理Figure 3 (a) 1H NMR titration spectra of probe Nap-CHCN upon addition of CN- in CDCl3 (from the bottom to top: 0, 0.2, 0.4, 0.8, 1.0, 1.5, 1.8 equiv.); (b) 13C NMR titration spectra of probe Nap-CHCN in CDCl3 upon addition of CN- ions (from the bottom to top: 0, 1.5. equiv. TBACN); (c) Sensing mechanism |
1.5 探针Nap-CHCN识别氰根离子的试纸条应用
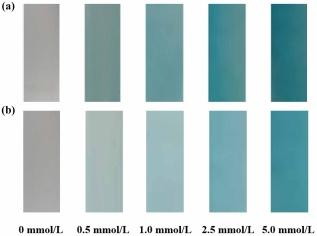
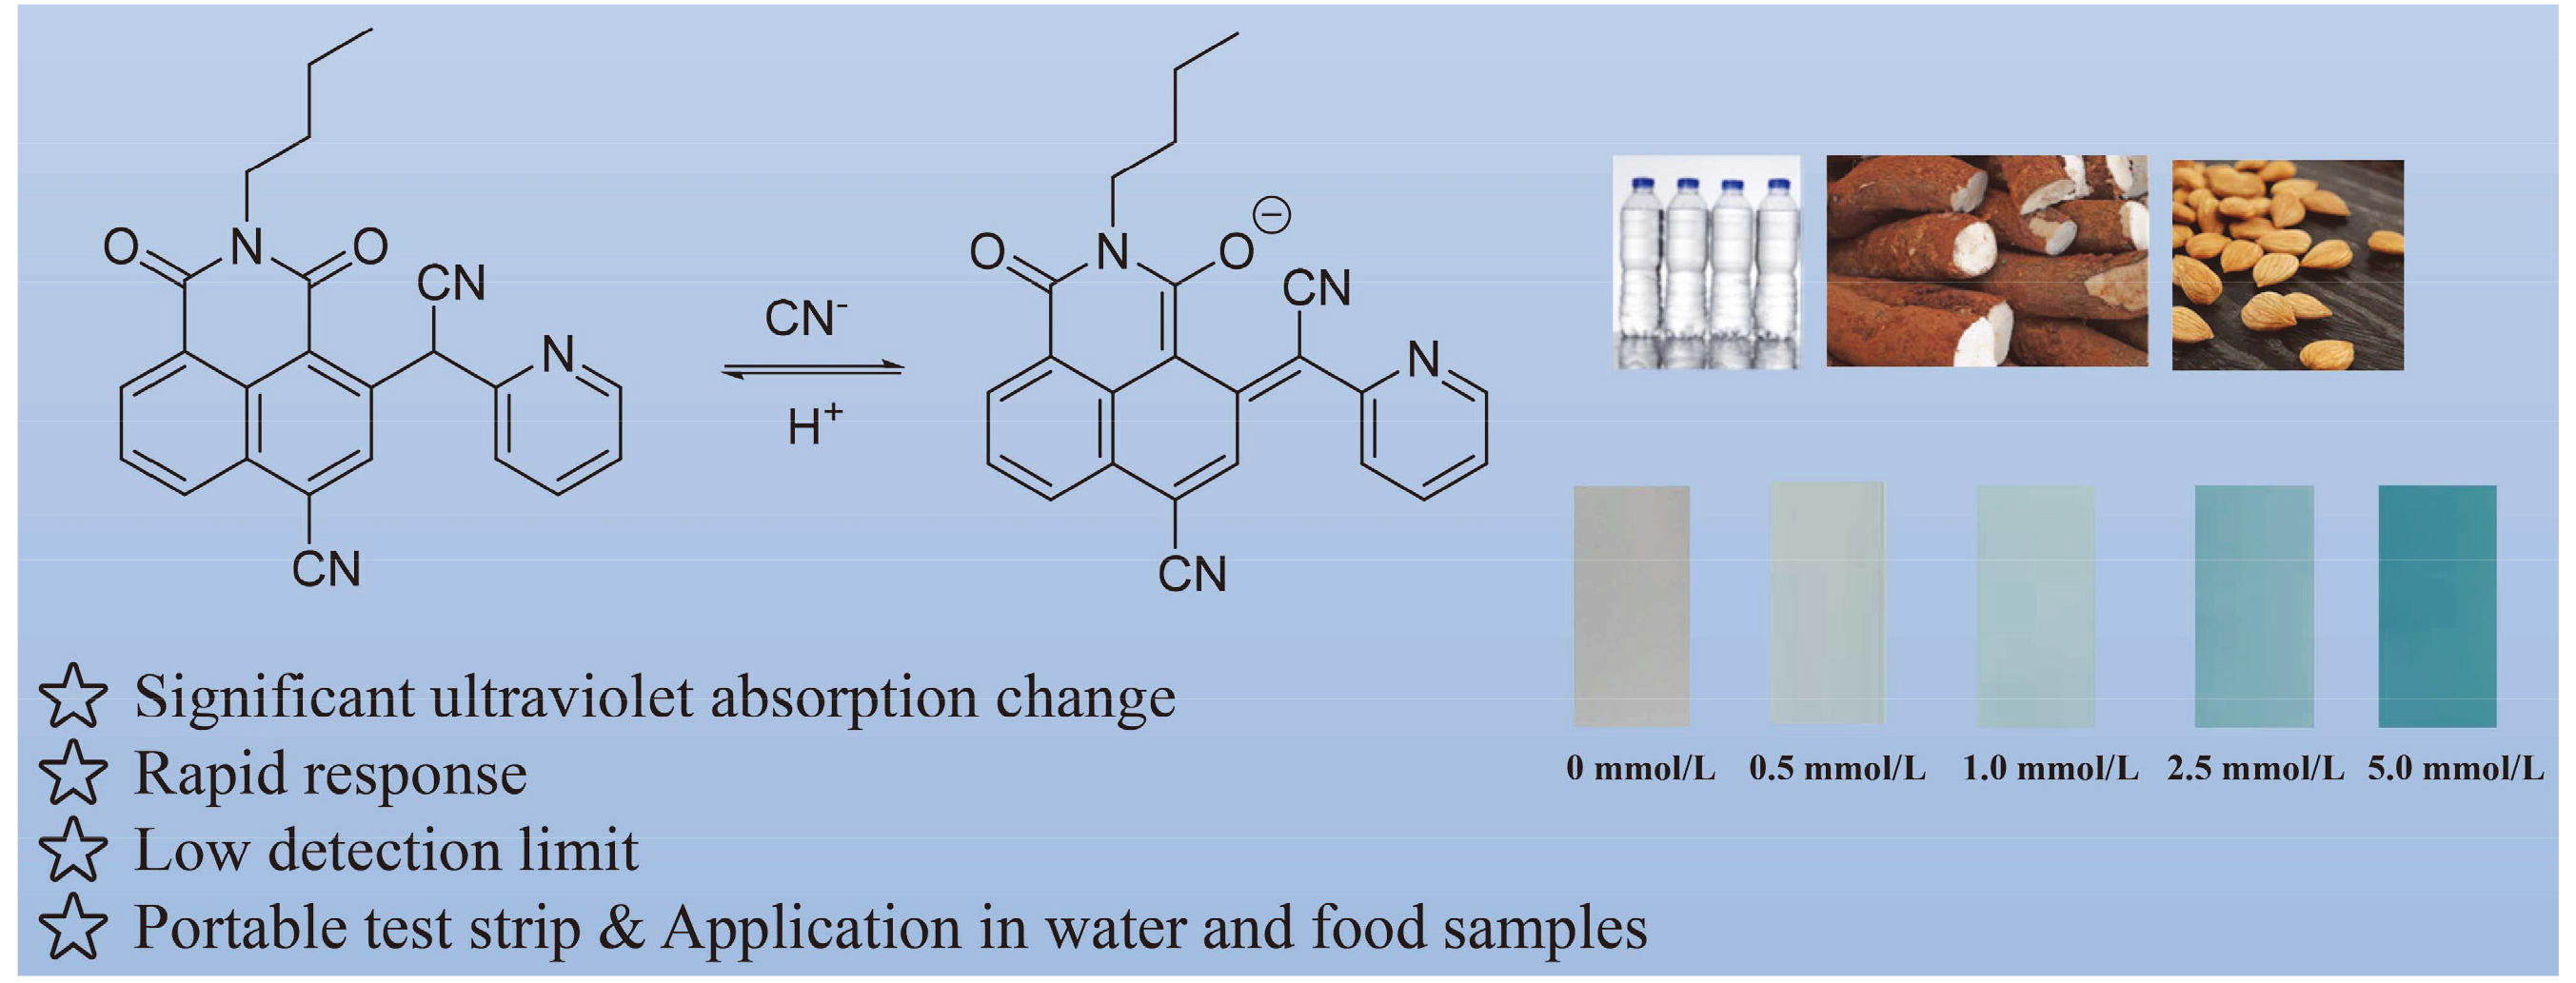
图4 (a)探针Nap-CHCN的检测试纸条随不同CN-浓度梯度作用后的颜色变化; (b)探针Nap-CHCN的检测试纸条随不同OH-浓度(TBAOH)梯度作用后的颜色变化Figure 4 Colorimetric response of Nap-CHCN immobilized test strips to CN- concentration gradients; (b) Colorimetric response of Nap-CHCN immobilized test strips to OH- concentration (TBAOH) gradients |
1.6 探针Nap-CHCN识别氰根离子的食品应用
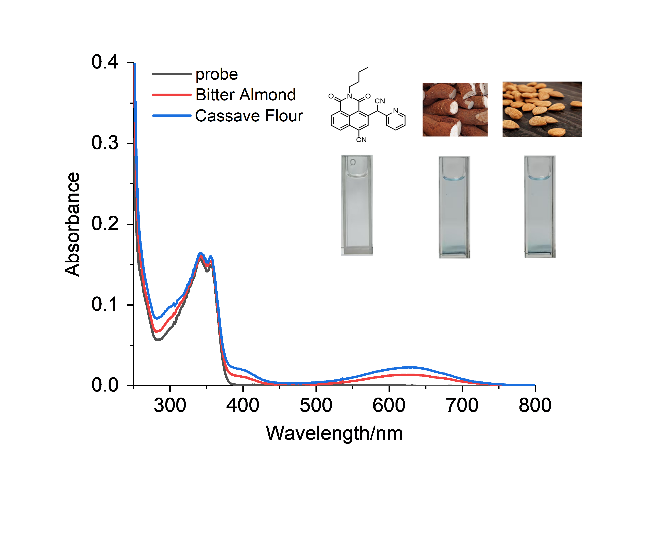
图5 探针Nap-CHCN与含氰化物食品样本提取液作用的紫外吸收光谱响应(插图为探针Nap-CHCN与食品提取液反应后溶液颜色变化对比图)Figure 5 UV-vis absorption spectral response of probe Nap- CHCN with cyanide-containing food sample extracts (The inset shows the comparative color changes of the solution after the reaction between probe Nap-CHCN and food extract) |
1.7 探针Nap-CHCN识别氰根离子的真实水样应用
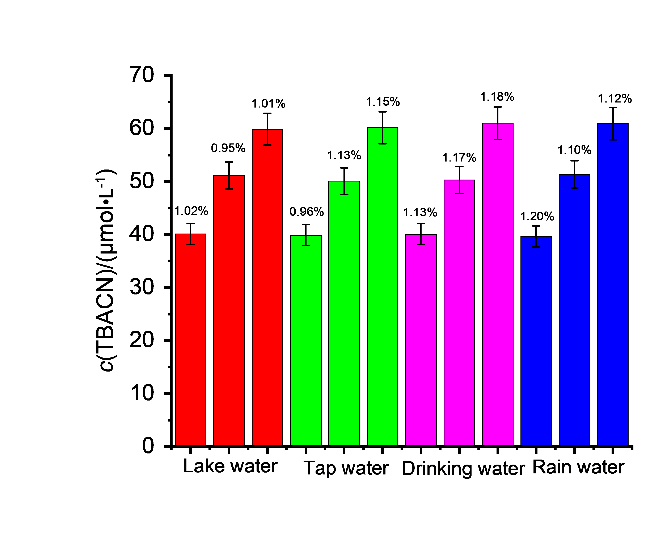
表1 紫外-可见光谱法测定加标水样中CN-含量(n=3)Table 1 Determination of cyanide (CN-) in spiked water samples by UV-Vis spectrophotometry (n=3) |
| Sample | Spiked/ (μmol•L-1) | Found/ (μmol•L-1) | Recovery/% | RSD/% |
|---|---|---|---|---|
| Lake water | 40 | 40.12 | 100.30 | 1.02 |
| 50 | 51.12 | 102.24 | 0.95 | |
| 60 | 59.87 | 99.78 | 1.01 | |
| Tap water | 40 | 39.89 | 99.73 | 0.96 |
| 50 | 50.08 | 100.16 | 1.13 | |
| 60 | 60.14 | 100.23 | 1.15 | |
| Drinking water | 40 | 40.09 | 100.23 | 1.13 |
| 50 | 50.28 | 100.56 | 1.17 | |
| 60 | 61.01 | 101.68 | 1.18 | |
| Rain water | 40 | 39.64 | 99.10 | 1.20 |
| 50 | 51.36 | 102.72 | 1.10 | |
| 60 | 60.93 | 101.55 | 1.12 |