





1 引言
2 碳点的结构基础与SiO2限域设计策略
2.1 碳点的原料来源与可能结构
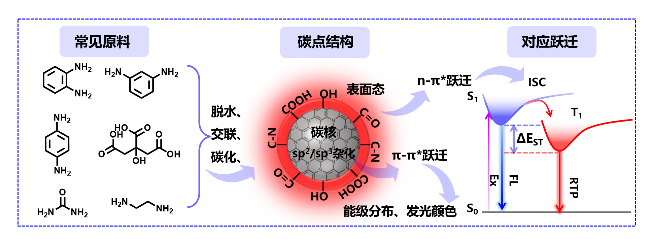
图2 碳点结构-跃迁-性能关联示意图. 左侧: 典型前驱体与官能团来源; 中间: 碳点可能结构模型; 右侧: 激发态跃迁类型与光物理意义Figure 2 Diagram illustrating the structure-transition-property relationship of carbon dots. Left side: typical precursors and sources of functional groups; middle: possible structural models of carbon dots; right side: types of excited-state transitions and their photophysical significance |
2.2 原位合成法
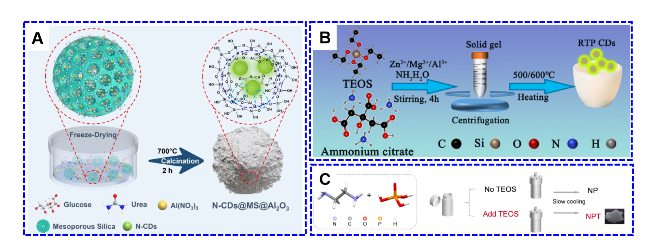
图3 原位合成与双基体限域策略示意图[32] (A); 原位水解-煅烧协同合成路径示意图[33] (B); 分子间作用力调控激活磷光策略示意图(C)[34]Figure 3 Schematic diagram of in-situ synthesis and dual-matrix confinement strategy (A)[32]; schematic diagram of in-situ hydrolysis-calcination synergistic synthesis pathway (B)[33]; schematic diagram of intermolecular interaction regulation to activate phosphorescence strategy (C)[34] |
2.3 后封装法
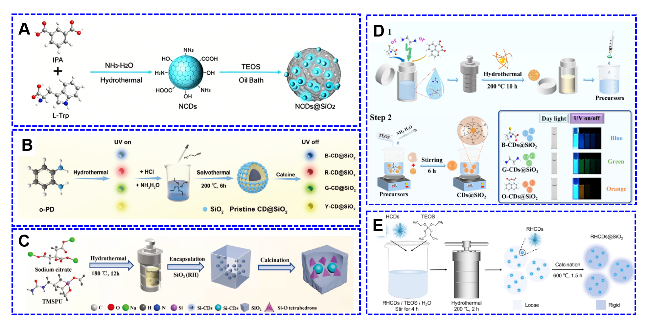
图4 NCDs@SiO2的溶胶‑凝胶后封过程示意图[36] (A); 彩色磷光碳点@SiO2高温煅烧合成示意图[38] (B); Si-CDs@SiO2复合物的工艺示意图[39] (C); 表面硅化-三维网络协同限域策略示意图[40] (D); 基于稻壳的生物质利用合成策略示意图[41] (E)Figure 4 Schematic diagram of the sol-gel post-sealing process for NCDs@SiO2 (A)[36]; schematic diagram of the high-temperature calcination synthesis of color-tunable phosphorescent carbon dots@SiO2 (B)[38]; schematic diagram of the preparation process for Si-CDs@SiO2 composites (C)[39]; schematic diagram of the surface silanization-three-dimensional network synergistic confinement strategy (D) [40]; schematic diagram of the biomass utilization synthesis strategy based on rice husks (E)[41] |
3 磷光增强机制与性能调控
3.1 磷光产生的理论基础: 乔布隆斯基图
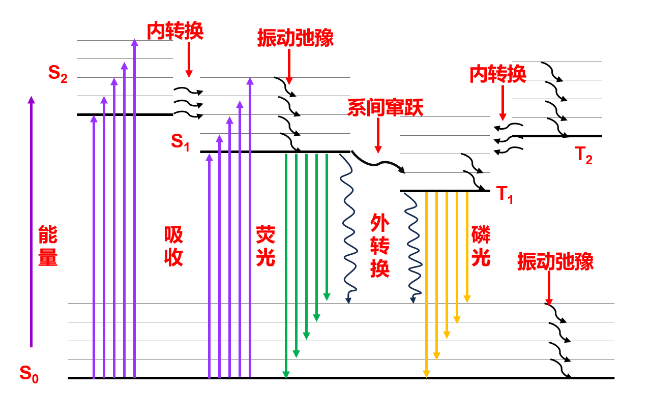
3.2 刚性限域与共价键固定
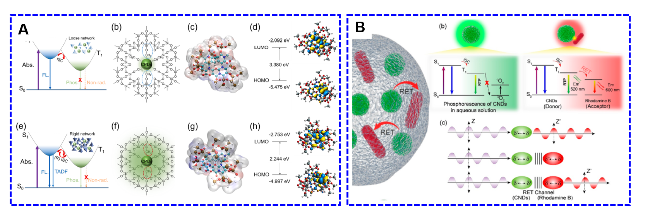
图6 CPDs-MSNs与C-CPDs-MSNs的能级结构、可能结构模型、分子表面静电势分布(模型中青色为C原子, 棕色为Si原子, 红色为O原子, 蓝色为N原子, 白色为H原子)以及HOMO与LUMO分布图[47] (A); 磷光CNDs辅助的FRET示意图, 展示了CNDs-RhB@二氧化硅纳米复合材料的构成、余辉机理以及供体(磷光CNDs)与受体(RhB)之间通过电磁相互作用发生的FRET过程[48] (B)Figure 6 Energy level structures, possible structural models, molecular surface electrostatic potential distributions (in the models, cyan represents C atoms, brown represents Si atoms, red represents O atoms, blue represents N atoms, and white represents H atoms), and HOMO and LUMO distributions of CPDs-MSNs and C-CPDs-MSNs[47] (A); schematic diagram of phosphorescent CNDs-assisted FRET, illustrating the composition of CNDs-RhB@silica nanocomposite, the afterglow mechanism, and the FRET process occurring between the donor (phosphorescent CNDs) and acceptor (RhB) through electromagnetic interaction[48] (B) |
3.3 能量转移策略与多色发光
3.4 寿命与量子产率优化路径
3.4.1 基质刚性与致密化工程
3.4.2 碳点本征结构与电子态调控
3.4.3 界面耦合与作用力强化
3.4.4 能量转移与缺陷态协同管理
3.4.5 性能总结与量化分析
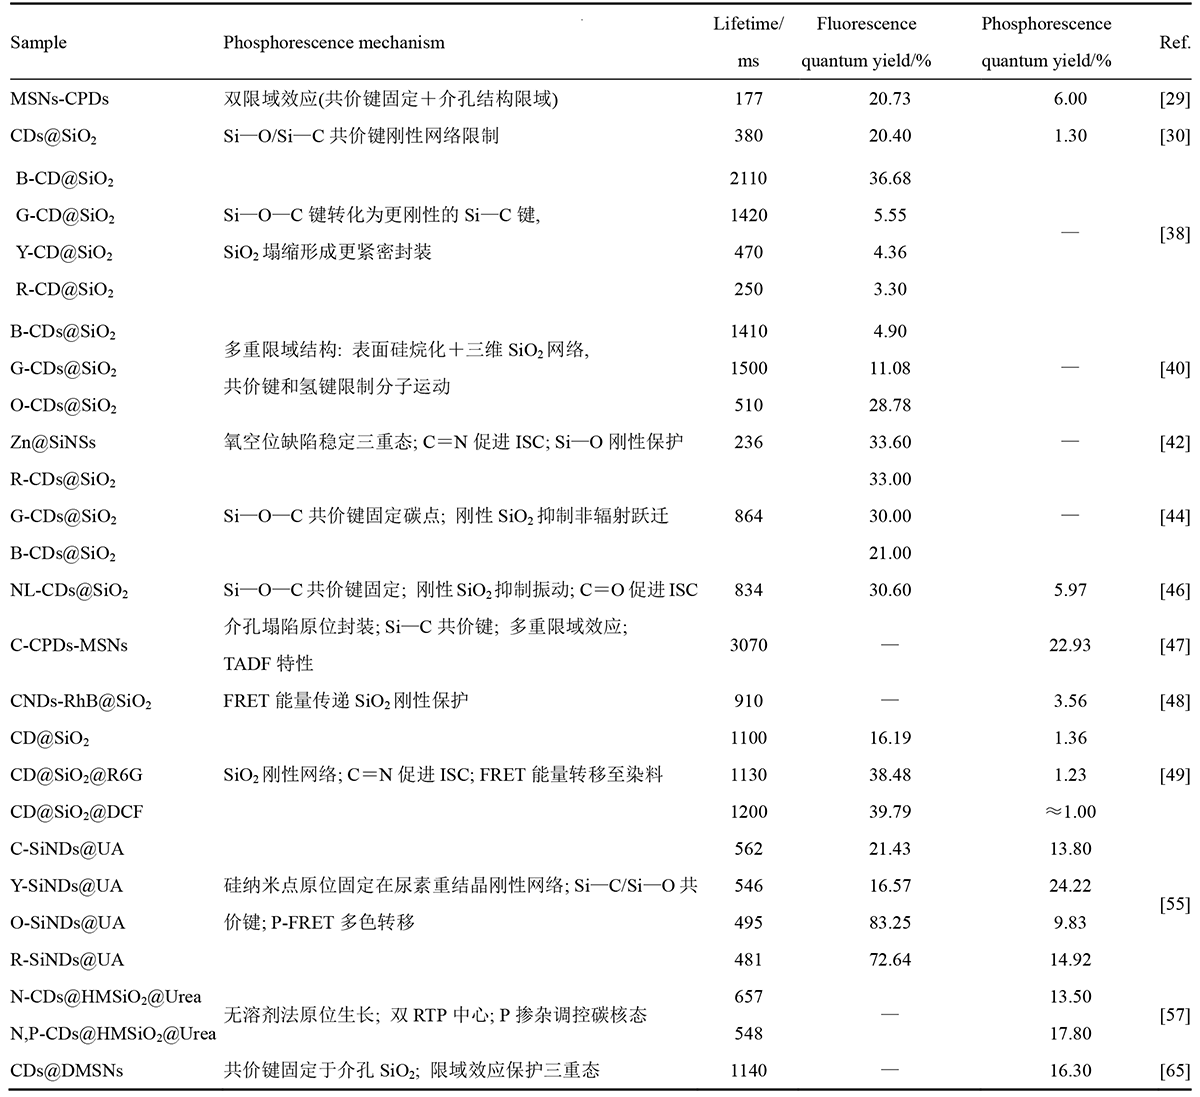
表1 近期报道的SiO2限域碳点室温磷光材料性能汇总Table 1 Summary of recently reported performance of SiO2-confined carbon dot room-temperature phosphorescence materials |
 |
4 多功能分析应用
4.1 防伪与信息加密
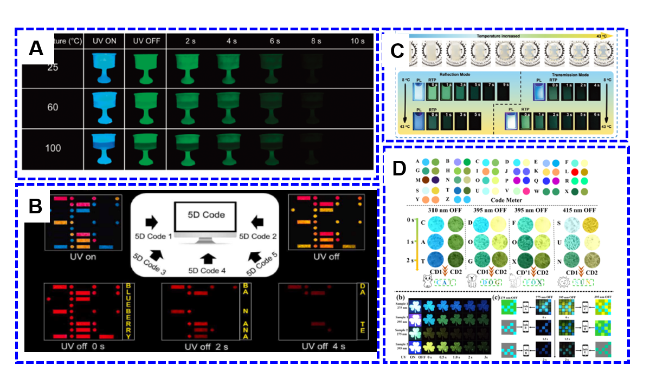
图7 用于温度可视化的3D艺术品[54] (A); 在365 nm紫外光下观察到由三种材料构成的初始编码信息(5D Code 1), 紫外光移除后呈现余辉编码信息(5D Code 2)[55] (B); PC凝胶透明状态随温度变化的照片, 以及PC凝胶在不同模式和温度环境下光致发光及时间依赖性室温磷光照片[56] (C); 基于时间依赖性室温磷光材料的彩色3D编码用于高级动态信息加密[57] (D)Figure 7 3D artwork for temperature visualization[54] (A); initial coding information composed of three materials observed under 365 nm UV light (5D Code 1), and afterglow coding information presented after removal of the UV light (5D Code 2)[55] (B); photographs of the transparent state of PC gels varying with temperature, and photographs of PL and time-dependent RTP of PC gels in different modes and temperature environments[56] (C); colored 3D codes based on time-dependent room-temperature phosphorescent materials for advanced dynamic information encryption[57] (D) |
4.2 化学及生物传感
4.2.1 离子检测
4.2.2 小分子检测
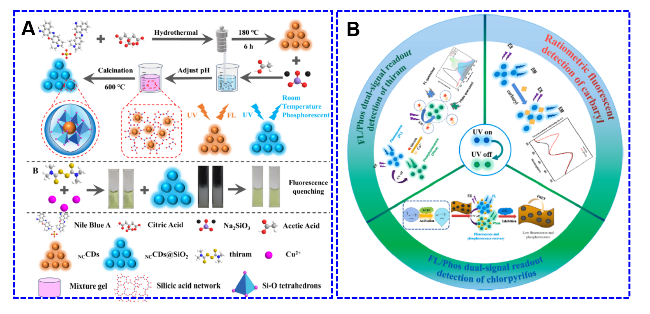
图8 NCCDs@SiO2传感系统的合成步骤示意图及其借助Cu2+辅助检测福美双的实验示意图[60] (A); 基于PAT-CDs@SiO2的荧光磷光双信号读出平台用于甲萘威、福美双和毒死蜱多通道检测的示意图[61] (B)Figure 8 Schematic diagram of the synthesis steps of the NCCDs@SiO2 sensing system and its experimental schematic for thiram detection with Cu2+assistance[60] (A); schematic illustration of the fluorescence and phosphorescence dual-signal readout platform based on PAT-CDs@SiO2 for multi-channel detection of carbaryl, thiram, and chlorpyrifos[61] (B) |
4.2.3 生物标志物检测
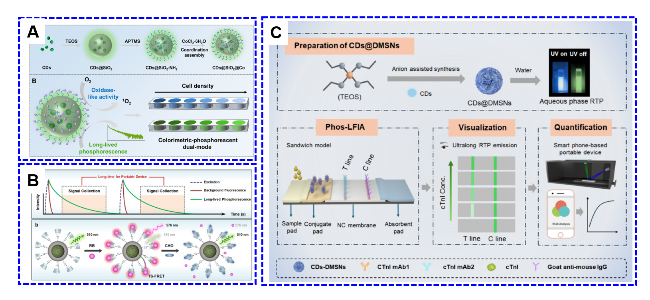
图9 谷胱甘肽的磷光-比色双模式检测示意图[63] (A); 胆固醇的比率磷光检测示意图[64] (B); CDs@DMSNs水相室温磷光微球的合成示意图及基于智能手机便携设备的磷光侧向流免疫分析快速定量检测cTnI的原理示意图[65] (C)Figure 9 Schematic diagram of phosphorescence-colorimetric dual-mode detection for glutathione (A)[63]; schematic diagram of ratio phosphorescence detection for cholesterol (B)[64]; schematic diagram of the synthesis of CDs@DMSNs aqueous-phase room-temperature phosphorescent microspheres and the principle of phosphorescence lateral flow immunoassay for rapid quantitative detection of cTnI using a smartphone-based portable device[65] (C) |
4.3 细胞与活体成像
4.3.1 细胞成像
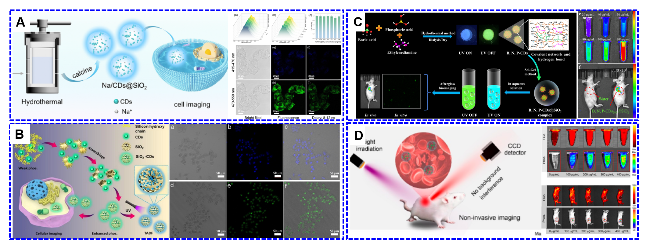
图10 Na/CDs@SiO2的制备过程及细胞成像示意图[68] (A); CD-SiO2组装过程示意图及光致发光CD-SiO2的细胞成像图[69] (B); B,N,P-CDs@SiO2小鼠活体成像示意图[70] (C); CNDs-RhB@silica近红外余辉的小鼠活体成像[48] (D)Figure 10 Schematic diagram of the preparation process and cell imaging of Na/CDs@SiO2 (A)[68]; schematic diagram of the CD-SiO2 assembly process and photoluminescence-based cell imaging with CD-SiO2 (B)[69]; schematic diagram of in vivo imaging in mice using B,N,P-CDs@SiO2 (C)[70]; schematic diagram of in vivo near-infrared afterglow imaging in mice using CNDs-RhB@silica (D)[48] |