

1 Introduction
Succinylcholine (SC, Figure 1a) is a depolarizing muscle relaxant that induces skeletal muscle relaxation by binding to nicotinic acetylcholine receptors on the neuromuscular junction. It is one of the earliest anesthetic agents discovered and utilized in humans. In addition to its application during anesthesia and surgical procedures, SC is essential for ensuring the smooth execution of tracheal intubation and mechanical ventilation in critically ill patients, necessitating a rapid onset and short duration of action.[1] As a nicotinic acetylcholine receptor antagonist, SC can lead to arrhythmias when administered in high doses directly into the human body, which can be life- threatening in severe cases.[2] Furthermore, some criminals have exploited SC by formulating it into toxic syringes or darts for use in theft or other criminal activities, often resulting in poisoning or even fatalities.[3] Therefore, the rapid detection of SC plays a crucial role in clinical emergency care and forensic evaluation and identification of harmful substances in criminal cases. This capability holds significant implications for both clinical practice and public safety.
Traditional detection methods for SC include liquid chromatography,[4] mass spectrometry,[5] spectroscopy,[6] and capillary electrophoresis.[7-8] In recent years, new techniques such as liquid chromatography-electrochemical coupling,[9-10] liquid chromatography-mass spectrometry coupling,[11-12] and surface-enhanced Raman scattering[13-14] have also been successfully applied to SC detection. However, these methods may be complex in operation, lack specificity, or exhibit low sensitivity. Given the presence of two ester bonds in the SC structure that are prone to hydrolysis, there is a pressing need to establish a rapid and straightforward novel detection method for SC. Recently, supramolecular sensing based on molecular recognition has garnered significant attention in analytical chemistry due to its high selectivity and sensitivity.[15-22] Among these approaches, the supramolecular indicator displacement assay (IDA) relies on the competitive binding of a target analyte and an indicator to a host molecule. The host has a higher affinity for the target analyte than for the indicator. When the indicator binds to the host, it produces an optical signal such as absorbance, fluorescence intensity, or color. Upon adding the target analyte, it displaces the indicator from the host, causing a change in the optical signal. This change is used to detect and quantify the target analyte.[23-26] This technology offers advantages such as low synthesis workload, rapid response times, and high sensitivity, positioning it for extensive applications in the field of biosensing.[27-33]
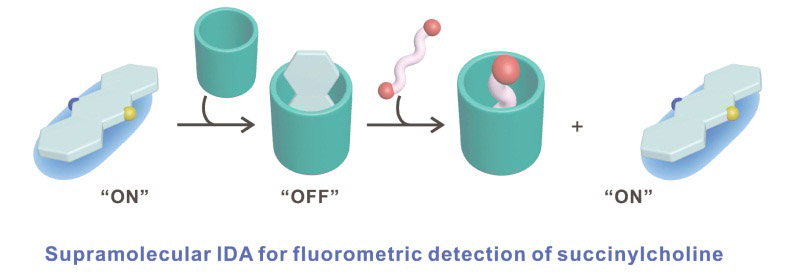
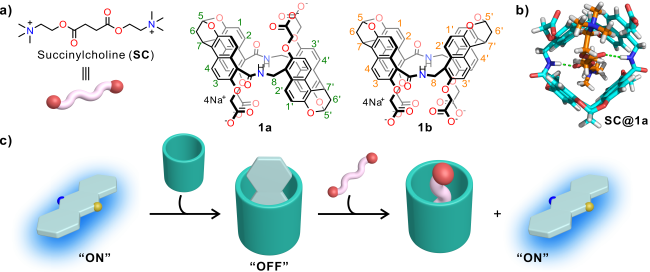
To develop an efficient detection method for SC, it is imperative to identify a host capable of high-affinity specificity toward SC.[34-36] SC is highly hydrophilic as its oil- water partition coefficient (Kow) is less than 0.01 at pH 7.4. The recognition of hydrophilic molecules in aqueous environments presents a considerable challenge in molecular recognition. In recent years, our research has concentrated on the aqueous phase molecular recognition and application of amide naphthotubes, which feature amide nitrogen- hydrogen bonds buried in their cavities.[37] By harnessing hydrogen bonding interactions shielded by the hydrophobic cavity, we have achieved selective recognition of hydrophilic molecules.[38] This approach has led to applications across various domains, including optical sensing,[39] drug reversal,[40] biorthogonal chemistry,[41] and pollutant adsorption removal.[42] Structurally, anti-amide naphthotube (1a, Figure 1a) represents ideal candidates for recognizing SC (Figure 1b): the elongated linear structure of SC aligns well with the binding preferences exhibited by the hosts. The central region of SC linear structure possesses relatively hydrophobic characteristics that complement the deep hydrophobic cavity of the amide naphthotube. Moreover, its ester bonds form complementary double hydrogen bonds with the amide groups present in the host cavity. Additionally, the water-soluble quaternary ammonium salts at two SC ends enhance binding through electrostatic attraction to the peripheral carboxylate ions of 1a. Therefore, in this study, we exploited the specific binding between amide naphthotube and SC to construct a fluorescence-based analytical method employing the IDA strategy for rapid and accurate detection of SC (Figure 1c). This methodology successfully facilitated the precise quantification of SC in pharmaceutical formulations and plasma samples.
2 Results and discussion
2.1 Recognition of SC with amide naphthotubes
The initial investigation into the interaction between our hosts and SC in water was conducted using 1H NMR spectroscopy (Figures 2a). The analysis revealed that both complexes exhibit fast exchange dynamics between their bound and free forms in the timescale of NMR, resulting in chemical shifts that represent an average of these states. Consequently, many signals were broadened or undetectable, making precise assignments challenging. For example, with SC inclusion in 1a (Figure 2a), noticeable shifts were observed in the aromatic signals of the host. Furthermore, some guest signals were missing, while specific methylene signals (proton d) from the guest molecules shifted from δ 2.7 to approximately δ -1.5. These spectral changes collectively suggest that guest molecules are encapsulated within the host’s cavity. To further elucidate the binding mode of SC in 1a, we conducted the 1H NMR experiments in H₂O/D₂O (V∶V=9∶1) mixture. It was found that the peak of the NH proton of 1a underwent significant shift, indicating the formation of hydrogen bond between NH and the ester groups of SC.
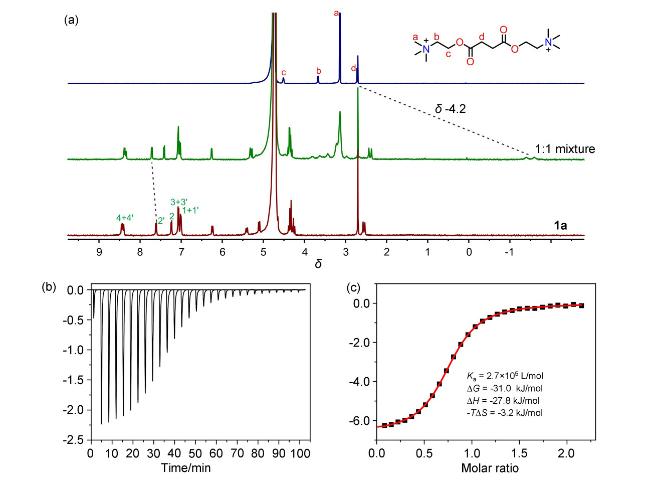
Figure 2 (a) 1H NMR spectra (500 MHz, D2O, 25 ℃, 1.0 mmol/L) of SC (top), 1a (bottom), and their 1∶1 mixture (middle), (b) raw ITC data collected from titration of 1a with SC in water at 25 ℃, and (c) apparent reaction heat derived from the integration of calorimetric traces and analyzed using the “one set of binding sites” model |
To determine the binding strength of SC with different configurations of naphthotubes and to elucidate the changes in thermodynamic parameters during the binding process such as enthalpy and entropy, we measured the binding constants of SC with 1a and 1b using isothermal titration calorimetry (Figures 2b, 2c). The results indicated that the binding strength of 1a for SC reached 2.7×10⁵ L/mol, which is 50 times higher than that of 1b. This significant difference can be attributed to the presence of carboxylate anions at both ends of the cavity in 1a, which perfectly complement the quaternary ammonium cations at both ends of SC, effectively enhancing the binding through electrostatic interactions. In contrast, for 1b, all four carboxylate groups are located at one end of the cavity, resulting in a weaker electrostatic attraction and consequently a markedly lower binding strength compared to 1a. From a thermodynamic perspective, both binding processes are primarily driven by enthalpy, with entropy playing a minor role that can be either slightly favorable or unfavorable. In light of the superior binding performance of 1a with SC, 1a was selected for the subsequent construction of the sensor.
2.2 Recognition and optical response of methylene blue with 1a
The detection signal output in IDA is achieved through the competitive binding between the analyte and the indicator. Therefore, selecting an appropriate indicator is crucial for constructing IDA sensors. An ideal indicator might exhibit suitable binding strength to the host and demonstrate a significant change in fluorescence intensity between its free and complexed states. In this study, methylene blue (MB) was selected as the indicator due to its elongated structure, which was well-matched in size and shape to the cavity structure of 1a. Additionally, nitrogen and sulfur atoms of MB could form hydrogen bonding interactions with the amide linkages directed toward the interior of the cavity. Previous research has shown that the fluorescence of these dyes is typically quenched by our- hosts through charge transfer, and the sensor constructed based on 1b has successfully achieved the fluorometric detection and analog discrimination of melatonin.[43] Consequently, the addition of the analyte can generate an activated fluorescence signal.
The interaction between 1a and MB in water was investigated using 1H NMR. After mixing MB and 1a in a 1∶1 molar ratio, significant changes were observed in the 1H NMR peaks corresponding to the dye and 1a, indicating that MB was accommodated in the cavity of 1a. Subsequently, UV-vis absorption and fluorescence titration experiments were conducted to study how binding affects spectral properties (Figure 3a). In the UV-vis titration experiment, the addition of 1a resulted in a notable decrease in absorption intensity within the wavelength range of 550~678 nm, while an increase was observed in the range of 678~740 nm, resulting in a pronounced isosbestic point that suggested the formation of a 1∶1 complex between 1a and MB. Based on this 1∶1 binding model, nonlinear curve fitting methods were utilized to determine that the binding constant for MB with 1a is 7.2×10⁴ L/mol from changes in absorbance at 686 nm. In fluorescence titration experiments, the continuous addition of the host solution to an MB solution resulted in the gradual quenching of MB fluorescence (Figure 3b). The isosbestic point was chosen as the excitation wavelength during titration to eliminate potential influences from varying concentrations of different components on excitation light absorption intensity, ensuring that changes in observed fluorescence intensity were primarily due to the formation of supramolecular host-guest complexes. Similarly, following a 1∶1 binding model and utilizing nonlinear curve fitting based on fluorescence intensity at 690 nm, a binding constant for MB was obtained with 1a of 7.8×10⁴ L/mol which is consistent with data obtained from UV titration experiments.
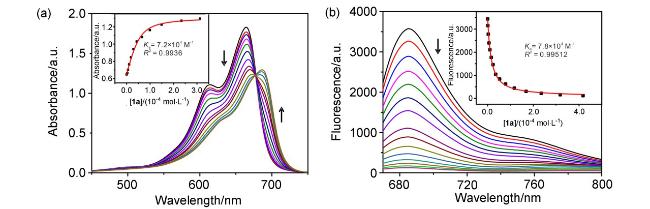
Figure 3 (a) UV-Vis absorption spectra of MB when titrated with host 1a in 10 mmol/L PBS buffer (pH 7.4) at 25 ℃ (inset: nonlinear curve fitting of the titration data according to a 1∶1 binding stoichiometry), and (b) fluorescence spectra of MB (5.0×10⁻⁶ mol/L) when titrated with 1a in 10 mmol/L PBS buffer (pH 7.4) at 25 ℃ (inset: nonlinear curve fitting of the titration data according to a 1∶1 binding stoichiometry) |
2.3 Construction of fluorescence sensor
The development of the IDA sensor was then examined. The fluorescence emission quenching of MB upon the introduction of 1a represents a “switch-off” state. Conversely, upon the addition of SC to the system, the restoration of fluorescence intensity indicated a “switch-on” event. In control experiments lacking 1a, the addition of SC had minimal impact on MB fluorescence intensity. These findings suggested that the observed changes in fluorescence result from SC competitively displacing MB from the cavity of 1a, rather than from any direct interaction between SC and MB. The NMR titration experiments also provided valuable insights into the competition between SC and MB@1a. As SC was gradually added to the 1∶1 mixture of MB and 1a, the peak pattern and position shifted to that of SC@1a. Additionally, a characteristic peak for the proton d of bound SC appeared at δ -1.5, indicating that SC occupied the host cavity while MB was displaced. To further verify the formation of SC@1a, ESI-HRMS was performed. The results showed that ion peaks of SC@1a were observed in the 1∶1∶1 mixture of 1a, MB and SC. These results confirmed that SC could competitively displace MB from the host cavity and form the host-guest complex SC@1a.
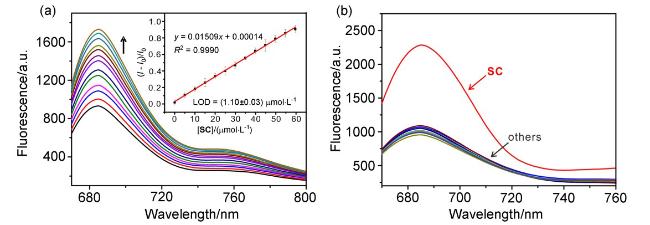
Based on the experimental findings obtained, it can be tentatively concluded that the IDA sensor formulated with MB@1a exhibits efficacy in detecting SC. Given that MB and 1a are bound through non-covalent interactions, both their concentration and ratio are critical for optimal sen-sor performance. Therefore, we examined how varying the concentration of the host-guest complex affects results. When the ratio of SC to 1a reached 80% (MB@1a at 5/55 μmol/L), the fluorescence response was at its strongest and most sensitive. As illustrated in Figure 4a, within a concentration range of 1.1~60 μmol/L, the fluorescence intensity (λem=690 nm) increased linearly with rising SC concentrations (R²=0.9990). The limit of detection (LOD) for SC was calculated to be 1.1 μmol/L using the formula LOD=3σ/slope, where σ denotes the standard deviation of the blank sample signal. This sensor demonstrates suitability for quantitative analysis of SC and achieves highly desirable limit of detection.
Figure 4 (a) Fluorescence spectra (λex=678 nm) of MB@1a (5/55 μmol/L) when titrated with SC up to 60 μmol/L (inset: the calculated limit of detection and detection range), and (b) fluorescence spectra of MB@1a solution upon the addition of SC or possible interfering substance (4 mmol/L for Mg2+, Fe3+, K+, Na+, Ca2+, and , 0.3 mmol/L for SC, Trp, Cys, Glu, GSH, CA, Glc, CH, Ach, CR and UA, respectively) |
2.4 Interference studies and real sample determination
To facilitate real-world applications, selectivity tests were conducted on the IDA sensor based on MB@1b. 16 representative interfering substances or ions sourced from biological fluids or pharmaceutical samples were selected for analysis. These substances included Mg2+, Fe3+, K+, Na+, Ca2+, , choline hydroxide (CH), acetylcholine (Ach), glucose (Glc), cysteine (Cys), glutamic acid (Glu), glutathione (GSH), uric acid (UA), tryptophan (Trp), creatine (CR) and citric acid (CA). Upon the incorporation of these interfering substances, the fluorescence intensity exhibited merely negligible augmentation (Figure 4b), thereby underscoring the remarkable selectivity of the sensor towards SC. This validation underscores the promising potential of the IDA sensor for achieving precise SC quantification in intricate matrices.
Our IDA exhibits exceptional linearity and a notably low detection limit for SC in phosphate buffer solution (PBS). Given the importance of SC detection in biological agents and fluids, a spiking recovery methodology was utilized to prepare SC at three distinct concentrations within samples of biological fluids and agents for subsequent analysis. Specifically, SC chloride injection served as the biological agent, while plasma was chosen as the biological fluid for SC detection. By substituting the obtained (I-I0)/I0 values into the standard equation, we calculated recovery percentages that ranged from 94.8% to 105.2%, as presented in Table 1. These findings suggest that the IDA sensor possesses the capability to effectively detect SC within complex biological samples and biologics.
Table 1 Determination of SC in real samples |
| Sample | Added/(μmol•L-1) | Founda/(μmol•L-1) | RSDb/% | Recovery/% |
|---|---|---|---|---|
| Succinylcholine injection | 5 | 4.84 | 6.4 | 96.8 |
| 25 | 24.95 | 4.3 | 99.8 | |
| 50 | 47.39 | 3.0 | 94.8 | |
| Plasma | 5 | 4.94 | 6.5 | 98.8 |
| 25 | 26.31 | 3.9 | 105.2 | |
| 50 | 47.82 | 3.7 | 95.6 |
a Mean value (n=3). b Relative standard deviation. |
3 Conclusions
In conclusion, we have developed a fluorescent sensor utilizing an anti-amide naphthotube for the detection of SC. This detection mechanism is based on fluorescence alterations resulting from competitive binding between the indicator MB and the target analyte SC. In this system, the interaction between MB and the host molecule induces fluorescence quenching of MB. Upon the introduction of SC, the fluorescence of MB is partially restored due to variations in affinity between the host and SC. This approach facilitates real-time detection of SC, achieving a detection limit of 1.1 μmol/L. Consequently, the amide naphthotube-based IDA sensor demonstrates significant potential for applications in drug sensing within forensic science and related disciplines.
4 Experimental section
4.1 General
1a and 1b were synthesized following synthetic procedures in literature.[44] All reagents for this study were obtained commercially and used as received unless stated otherwise. 1H NMR spectra were recorded on a Bruker 500 NMR spectrometer. Calculations were performed at the semi-empirical PM06 level using Spartan’14 (Wavefunction, Inc.). Fluorescence spectra were measured with a Shimadzu RF-6000 spectrophotometer, and UV-vis spectra were obtained using a Shimadzu UV-2600i spectrophotometer.
4.2 Isothermal titration calorimetry
Titration experiments were conducted in deionized water at 25 ℃ using a VP-ITC instrument. In each experiment, 1.4338 mL of a 0.10 mmol/L solution of 1a/1b was placed in the sample cell, and 292 µL of SC solution (1.5 mmol/L for 1a; 4.5 mmol/L for 1b) was loaded into the injection syringe. The titration involved an initial 2 µL injection followed by 28 consecutive 10 µL injections, with a 210 s interval between each. Heats of dilution from titrating SC with blank solvent were subtracted from the data. All solutions were degassed before titration. Data analysis was performed using the instrument internal software and fitted to a “one set of binding sites” model.
4.3 UV-Vis titration
For UV-Vis titrations, a solution of MB (5.0×10⁻⁵ mol/L) in 10 mmol/L PBS buffer (pH=7.4) in a cuvette (2.0 mL) was titrated with a 1a solution (1.0×10⁻³ mol/L) which was prepared with the original MB solution. A nonlinear curve-fitting of the change in absorbance (686 nm) with host concentrations was employed to determine the association constant using a single-site binding isotherm.
4.4 Fluorescence titration
For fluorescence titrations, a solution of MB (5.0×10⁻6 mol/L) in PBS buffer (10 mmol/L, pH=7.4) in a cuvette (2.0 mL) was titrated with 1a solution (2.0×10⁻³ mol/L) which was prepared with the original MB solution. A nonlinear curve-fitting of the fluorescence intensity (690 nm) with host concentrations was employed to determine the association constant using a single-site binding isotherm.
4.5 Assay procedure of SC
A specific quantity of SC solution (50 μL, dissolved in PBS buffer at a pH of 6) was introduced into an MB@1a solution (2.0 mL). Subsequently, the resultant mixture was analyzed using a fluorescence spectrofluorometer. The fluorescence intensities at a wavelength of 690 nm were documented and utilized for the quantification of SC. The selectivity of the assay was evaluated analogously by incorporating potential interfering substances into the system.
4.6 Analysis of SC in real samples
4.6.1 SC injection
Succinylcholine chloride injection was purchased from Xi'an Hanfeng Pharmaceutical Technology Co., Ltd. Xi'an, China. Drug specifications: 2.0 mL, 100 mg. Succinylcholine chloride injection was prepared in PBS in three concentrations of 50, 25, and 5 mmol/L. For the detection of SC, 2.0 mL of the MB@1a solution (5/55 μmol/L, λex=678 nm) was introduced into the fluorescent cuvette. Then 2.0 μL of the configured SC sample was added to the cuvette, and the SC final concentrations were 50, 25, and 5 μmol/L. Sample analysis was performed following the aforementioned assay protocol.
4.6.2 SC in plasma
SC was accurately weighed and directly added to plasma, and three SC concentrations of 50, 25, and 5 mmol/L were configured for subsequent experiments. Sample analysis was performed following the aforementioned assay protocol.
Supporting Information 1H NMR spectra of the complexes, ITC titration data, fluorescence spectra, and ESI-HRMS mass spectra. The Supporting Information is available free of charge via the Internet at http://sioc-journal.cn.
(Zhao, C.)