



1 Introduction
Organic luminescent materials play a pivotal role in modern society due to their tunable molecular structures, simple fabrication processes, adjustable emission wavelengths, and environmental friendliness.[1] They are widely applied in optoelectronic devices,[2-5] chemical sensing,[6] bioimaging,[7] and other fields, making them indispensable in contemporary material systems. Traditional organic luminescent materials are typically designed based on the through-bond conjugation (TBC) theory of delocalized π- electrons.[8] Within this framework, researchers have developed various strategies to modulate their photophysical properties, such as adjusting conjugation lengths[9] and introducing donor-acceptor (D-A) groups,[10-11] which have been crucial in optimizing conventional luminescent materials.
However, in the early 21st century, researchers observed unconventional luminescence in non-conjugated compounds, even those lacking π-electrons,[12-18] such as polyethylene glycol,[19] polyamides,[20-21] starch,[22] sodium alginate,[23] and aliphatic polyesters.[24-30] Despite lacking traditional TBC, these macromolecules exhibit bright visible-light emission due to weak intermolecular interactions, leading to their classification as weak interaction-based luminescent materials (WILMs).[31] Nevertheless, the flexibility and conformational dynamics of these polymers complicate the elucidation of their emission mechani- sms[32-33] Consequently, attention has shifted to well-de- fined small-molecule models, including diarylmethanes, triarylmethanes, tetraarylethanes, and other non-conjugated multiarylalkanes (MAAs). Studies on these systems have revealed that through-space interactions (TSI),[34] particularly through-space conjugation (TSC),[35-36] significantly influence their luminescence. Governed by TSC, non-con- jugated molecules exhibit narrower bandgaps and bathochromically shifted emissions. Further research identified multiple (π-π, n-π, n-n) TSC in MAAs. Investigating the TSC luminescent mechanisms in these systems not only refines the understanding of their photophysics but also establishes structure-property relationships, enhancing their emission performance. This progress provides critical theoretical and practical guidance for developing high- efficiency WILMs and achieving precise wavelength control.
This account systematically summarizes recent advances in the emission mechanisms and TSC regulation of diarylmethanes, triarylmethanes, tetraarylethanes, and related MAAs, focusing on three key strategies: (i) conformational control, restricting molecular motion via intra-/intermole- cular π-π TSC to enhance rigidity and emission; (ii) D-A electronic modulation, leveraging π-π TSC to optimize charge transfer and luminescence; (iii) n-electron engineering, introducing n-π and n-n TSC to strengthen TSC and improve efficiency. Collectively, π-π and n-π/n-n TSC are pivotal in WILMs. By elucidating these mechanisms and proposing efficient TSC-tuning strategies, this account aims to guide the design of novel WILMs and accelerate the development of high-performance, stable, and tunable luminescent materials.
2 Results and discussion
2.1 Diarylmethane
The skeleton of diarylmethane (DMA) consists of two aromatic rings connected by an alkyl chain. Due to the flexibility of the alkyl linker, the two aromatic rings can rotate relative to each other, potentially forming different conformations (such as coplanar, perpendicular, or tilted), thereby influencing the strength of intramolecular TSC. In this section, we will summarize the mechanisms governing TSC in DMA from three perspectives: conformation, donor-acceptor (D-A) electronic structure, and n-electron of aryl subunits.
2.1.1 Conformation
In 2017, Caseri’s team synthesized poly(phenylene methylene) (PPM) and its two derivatives, poly(2-methyl- phenylene methylene) (PMPM) and poly(2,4,6-trimethyl- phenylene methylene) (PTMPM) (Figure 1a).[37] Although these three polymers lack π-conjugated structures, they exhibit intense blue fluorescence in both solution and solid states. Detailed experimental characterization and theoretical calculations ruled out π-stacking, aggregation/crystal- lization, and anthracene-like impurities as possible origins of the emission. Instead, the study confirmed that homoconjugation between two adjacent benzenes serves as the primary mechanism, which is one kind of TSC. Due to the structural complexity and extended chain length of polymers, the interpretation of PPM luminescence and TSC mechanism is unclear. To address this, our team designed a series of six oligomers (OPM[2]-OPM[7]) based on the diphenylmethane (DPM) scaffold.[38] In the solid state, OPM[2] and OPM[3] displayed dual UV emissions: a peak nears 280 nm (attributed to isolated benzene rings) and another at 350 nm (corresponding to weak TSC within the DPM units). As the chain length increased, longer oligomers (OPM[4]-OPM[7]) exhibited an additional TSC emission at ca. 440 nm (Figure 1b). Among the six molecules, OPM[6] achieved the highest quantum yield (QY, 40%), which was attributed to its rigid structure as revealed by reorganization energy calculations and structural analysis. Further studies demonstrated that the long-wave- length emission (440 nm) in OPM[4]-OPM[7] originates from internal DPM segments with smaller dihedral angles, while the short-wavelength emission (350 nm) in all OPMs arises from terminal DPM segments with larger dihedral angles. These findings highlight a key distinction between TSC-based and TBC-based luminophores, unlike TBC systems, the emission wavelength of TSC-active molecules does not linearly increase with increasing chain length. Instead, their luminescence is governed by intramolecular TSC between adjacent aryl subunits, independent of chain elongation.
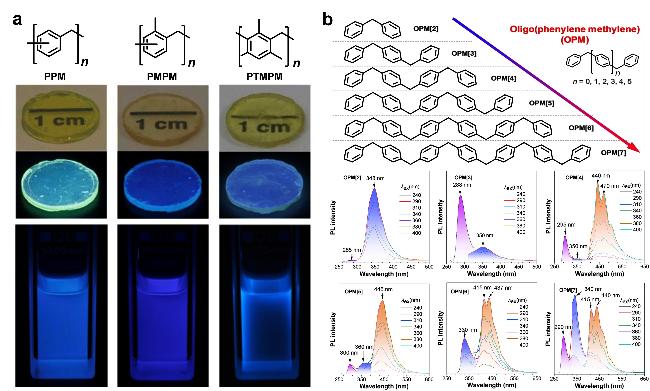
Figure 1 (a) Structures and luminescent photographs of PPM, PMPM and PTMPM in film and solution; (b) Structures and solid-state PL spectra of OPM[2]-OPM[7] under different excitation wavelength (λex)(a) Reproduced from Ref. [37], copyright 2017 John Wiley and Sons; (b) Reproduced from Ref. [38], copyright 2024 John Wiley and Sons. |
2.1.2 D-A electronic structure of aryl subunits
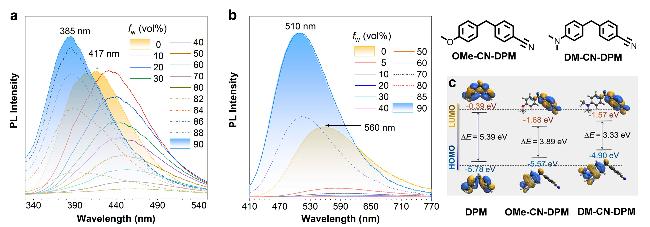
According to traditional TBC-based photophysics, introducing donor (D) and acceptor (A) moieties to construct charge transfer (CT) states is an effective strategy for tuning the photophysical properties of luminescent materials. Then, our team investigated this effect in the TSC systems. DPM was also used as the model structure[39] and its two derivatives were synthesized: OMe-CN-DPM (with a methoxy donor and cyano acceptor) and DM-CN-DPM (with a stronger dimethylamino donor and the same cyano acceptor).[40] Their CT properties were systematically investigated. As shown in Figure 2a, with the increased water fractions (fw) of acetonitrile/water mixtures, the maximum emission wavelength (λem) shifted from 417 nm (fw=0%) to 385 nm (fw=90%). When the donor was switched from methoxy to the more electron-rich dimethylamino group, the λem shifted from 560 nm (fw=0%) to 510 nm (fw=90%) (Figure 2b). These results suggest the CT nature of emission peaks in OMe-CN-DPM and DM-CN-DPM, which is the through-space charge transfer (TSCT). Figure 2c reveals that the HOMO and LUMO distributions in both OMe-CN-DPM and DM-CN-DPM are completely separated, confirming a CT-dominated electronic transition. Additionally, their energy gaps (3.89 eV for OMe-CN- DPM and 3.33 eV for DM-CN-DPM) are significantly smaller than that of the parent DPM (5.39 eV), consistent with their emission peak positions. These results demonstrate that D-A structural engineering can effectively modulate the luminescence of WILMs. However, challenges remain in the performances of WILMs, such as relatively low quantum efficiencies, indicating room for further optimization in future designs.
2.1.3 n-Electron structure of aryl subunits
Building upon previous findings, we observed that π-π TSC between benzene rings dominates the emission of DPM derivatives, regardless of chain-length modification or D-A electronic structure incorporation, with emission peaks consistently below 470 nm. However, recent studies on clusteroluminescence in heteroatom-containing non- conjugated polymers[29] suggest that lone-pair electrons from heteroatoms (such as N, S, and O) may facilitate stronger n-π or n-n TSC, thereby influencing the photophysical properties of MAAs. To investigate this, our team designed and synthesized three molecules: o-1Py-1Ph, o-2Py, and o-2Md, followed by systematic characterization of their photophysical behaviors.[41-42]
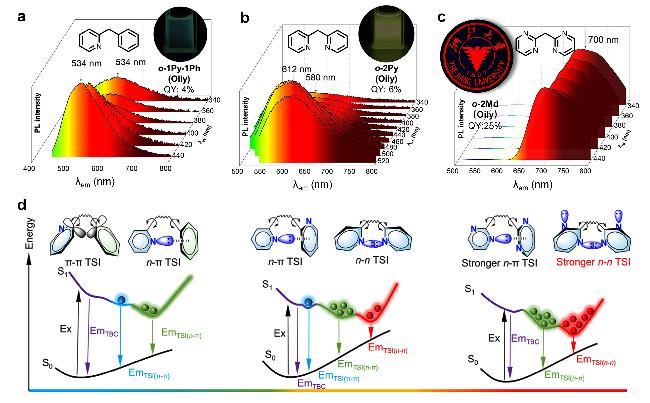
At room temperature, o-1Py-1Ph, o-2Py, and o-2Md exist as oily liquids. Unlike typical non-conjugated solids of MAAs, the fluidity of these three structures enhances molecular mobility, allowing for diverse excited-state conformations that critically govern their electronic structures and emission profiles. o-1Py-1Ph exhibits a single emission peak at 534 nm (QY=4%, Figure 3a), attributed primarily to n-π TSC. o-2Py displays excitation-dependent emission, gradually shifting from 580 nm to 612 nm (QY=6%, Figure 3b), a consequence of n-n TSC introduced by the additional nitrogen atom. o-2Md achieves a stable near-infrared emission at ca. 700 nm (QY=25%, Figure 3c), independent of excitation wavelength. The symmetric incorporation of two nitrogen atoms enhances n-n TSC efficiency, minimizing conformational disturbances. A schematic illustration of these processes was proposed in Figure 3d that nitrogen atoms enable multiple TSC pathways in these DPMs where n-π TSC forms a head-to-head, σ-type orbital interaction, stabilizing the conformation, reducing the energy gap, and enabling near-infrared emission (700 nm) in o-2Md.
Among these three modulation strategies, introducing n electrons into the aryl subunits was demonstrated to be the most effective approach for increasing the emission wavelength. This effect likely arises from the combined influence of the n electron orbital orientation and the higher energy level of the n orbital compared to the π orbital.
2.2 Triarylmethane
Significant progress has been made in understanding the TSC regulation mechanisms of DPM. However, the inherent flexibility of DPM materials may compromise TSC stability and result in low emission efficiency. The structural characteristics of triarylmethane (TPM) molecu- les[43-44], featuring pronounced steric hindrance between phenyl rings, not only enhance molecular rigidity, but also promote more stable TSC formation through intensified intermolecular and intramolecular interactions, thereby facilitating the development of high-performance WILMs.
2.2.1 Conformation
To investigate the conformational effect, our team has designed and synthesized three isomers of o-TBPM, m- TBPM, and p-TBPM which use biphenyl (BP) as the buil- ding block and TPM as the framework, with variations in the connection positions of three isolated BP units.[45] Based on the experimental results on DPM, the most crow-ded isomer of o-TBPM was expected to facilitate strong intramolecular TSC. However, o-TBPM exhibited a dominant emission peak at 308 nm (Figure 4a), corresponding to BP emission, with an additional weak TSC-based peak emerging at 390 nm under varying excitation wavelengths. Unexpectedly, m-TBPM displayed an excitation-indepen- dent emission peak at 374 nm (Figure 4b), characterized by 100% fluorescence quantum yield and a narrow full width at half maximum (FWHM) of 40 nm. The most flexible p-TBPM emitted at 365 nm (Figure 4c) with a high quantum yield of 76%.
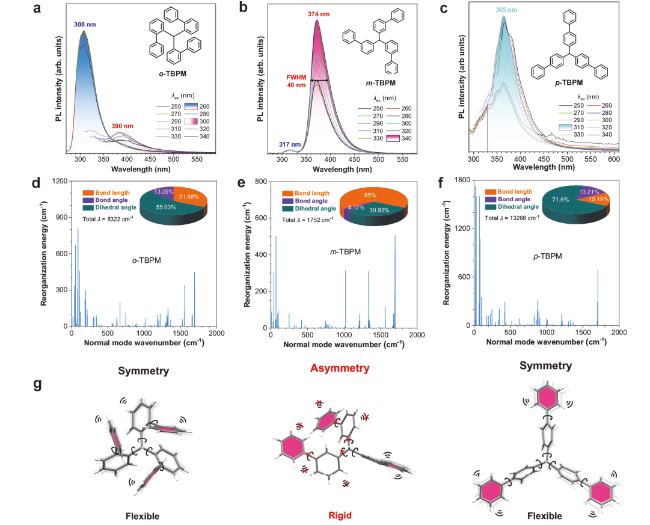
Figure 4 PL spectra of (a) o-TBPM, (b) m-TBPM, and (c) p-TBPM in the solid state with different excitation wavelengths; Reorganization energy of (d) o-TBPM, (e) m-TBPM, and (f) p-TBPM in the gas phase; (g) Single crystal structuresReproduced from Ref. [45], copyright 2024 Springer Nature. |
Theoretical calculations revealed that p-TBPM had the largest gas-phase reorganization energy (λ) of 13,268 cm-1, with 71.60% contributed by dihedral angle torsion, leading to significant geometric changes and nonradiative energy dissipation in the excited state. o-TBPM exhibited a total λ of 8,322 cm-1 with 55.03% contribution from dihedral angle torsion. In contrast, m-TBPM demonstrated the lowest total λ (1,752 cm-1), with only 30.83% contribution from dihedral motion, reflecting its rigid conformation, which resulted in narrowband emission (FWHM 40 nm) with 100% efficiency. In the crystalline state, p-TBPM and o- TBPM adopted near-symmetric conformations, while m- TBPM exhibited asymmetry conformation that two BP units were located on the same side (Figure 4g). Although the packing mode of p-TBPM featured multiple intermolecular interactions that restricted intramolecular motion, its flexible backbone failed to fully stabilize the formed TSC. For o-TBPM, limited intermolecular interactions and weak intramolecular TSC led to shorter emission peaks and lower quantum yields. In summary, m-TBPM rigid skeleton and abundant intermolecular interactions suppressed active intramolecular motion, enabling the formation of stable TSC for highly efficient luminescence.
Our team successfully synthesized four trinaphthylmethane (TNM) isomers (222-TNM, 122-TNM, 112-TNM, and 111-TNM) and conducted a systematic investigation of their photophysical properties.[46] As illustrated in Figure 5a, 222-TNM exhibits a single emission band centered at 340 nm, characteristic of isolated naphthalene ring emission. In contrast, the other three isomers (122-TNM, 112- TNM, and 111-TNM) display an additional long-wave- length emission at 375, 380, and 393 nm, respectively. Notably, this long-wavelength emission not only progre-ssively redshifts but also becomes increasingly dominant in the emission spectra (Figures 5b~5d). To elucidate the structural basis of these photophysical trends, we evaluated molecular rigidity through root-mean-square deviation (RMSD) calculations. The results reveal a clear trend of increasing molecular rigidity from 122-TNM to 111-TNM, with RMSD values decreasing from 0.13231 to 0.01713 nm (Figure 5e). This correlation strongly supports the hypothesis that enhanced molecular rigidity facilitates the strengthening of through-space conjugation (TSC). Furthermore, CrystalExplorer analysis of intermolecular interactions showed significant variations among the isomers. 222-TNM exhibited the strongest intermolecular forces (-90.2 kJ•mol-1 for dimer and -335.0 kJ•mol-1 for cluster), while 111-TNM displayed the weakest interactions (-41.1 kJ•mol-1 for dimer and -304.8 kJ•mol-1 for cluster) (Figure 5f). These findings collectively demonstrate that precise conformational control is crucial for tuning the photophysical properties of MAAs luminescent materials, where molecular architecture simultaneously governs both intramolecular TSC strength and intermolecular stabilization effects.
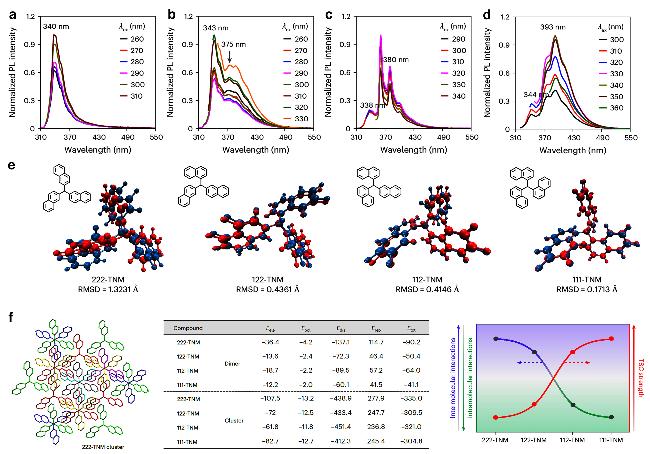
Figure 5 Solid-state PL spectra of (a) 222-TNM, (b) 122-TNM, (c) 112-TNM, and (d) 111-TNM with different excitation wavelengths; (e) Root-mean-square deviation (RMSD) calculations of these four isomers in the gas phase; (f) The intermolecular interaction analysis by the CrystalExplorer, and the schematic illustration of the influence of intra-/intermolecular interactions on the RSC strengthReproduced from Ref. [46], copyright 2024 Springer Nature. |
2.2.2 D-A electronic structure modulation
To verify the universality of D-A strategy for regulating TSC strength, our team synthesized triphenylmethane (TPM) and its derivatives with electron-donating groups (TPM-DMA and TPM-MO) and electron-withdrawing groups (TPM-CN and TPM-NO₂), systematically investigating their photophysical properties (Figures 6a~6d).[47] Except for TPM-NO₂, all molecules exhibited dual emission in the aggregated state: a short-wavelength peak originating from isolated subunits and a long-wavelength peak attributed to intramolecular TSC. Introducing electron- donating groups (TPM-DMA and TPM-MO) resulted in a red-shifted emission wavelength and enhanced quantum yield (QY) compared to the naked TPM. In contrast, introducing electron-withdrawing groups (TPM-CN and TPM-NO₂) led to a red shift in emission but reduced emission efficiency. As illustrated in Figure 6e, to explore how donor or acceptor groups influence TSC, we mapped the electron density-based electrostatic potential of the excited state. Regions in red indicate high electron density, while blue corresponds to low density. The incorporation of electron-donating groups not only increased the electron density of TSC but also restricted intramolecular motion, stabilizing the formed TSC. For TPM-CN and TPM-NO2, although the electron-withdrawing groups decrease the electron density of the central phenyl groups, the emerging charge-transfer state increases the emission wavelength but decreases the emission efficiency. The above results indicate that enhancing the electron density of TSC subunits represents an effective strategy for strengthening intramolecular TSC. However, the simultaneous incorporation of donor and acceptor groups into the triarylmethane system has not yet been achieved. It is anticipated that such modification would induce TSCT effects similar to those observed in diarylmethane systems.[48] Therefore, future studies will focus on verifying the presence of TSCT in triarylmethane derivatives.
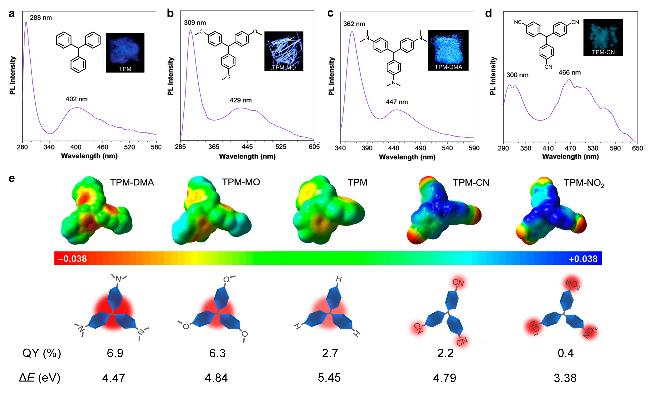
Figure 6 Solid-state PL spectra of (a) TPM, (b) TPM-MO, (c) TPM-DMA, and (d) 111-TNM; (e) Electronic static potential mapped on the isosurface of electronic density, experimental luminescence quantum yield and calculated energy gapReproduced from Ref. [47], copyright 2021 American Chemical Society. |
2.3 Tetraarylethanes
Based on a systematic investigation of the luminescence mechanisms in diarylmethane and triarylmethane, we observed a distinct red-shift in the emission peak of TPM compared to DPM (from 348 nm to 402 nm). A similar trend was noted upon modulation of the D-A electronic structure (red-shift from 372 nm to 466 nm). These results suggest that increasing the number of aromatic rings could enhance TSC. However, a trade-off persists between high efficiency and desirable emission wavelength. To address this limitation, we turned our attention to the more structurally complex tetraarylethane system. The additional aromatic ring in tetraarylethane may not only strengthen TSC but also introduce moderate molecular flexibility, potentially creating novel interaction sites. This structural evolution could lead to a stepwise improvement in TSC efficiency.
2.3.1 Conformation
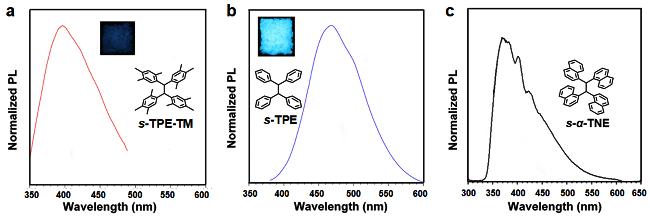
Our team designed and synthesized two molecules, s- TPE-TM and s-TPE, and systematically investigated their photophysical properties.[35] As shown in Figure 7a, s- TPETM exhibits a solid-state emission peak at 397 nm with a QY of 9%, while s-TPE displays a significantly red- shifted emission at 467 nm and a much higher QY of 69% (Figure 7b). This represents a remarkable improvement compared to DPM and TPM systems. Theoretical calculations reveal that although s-TPE-TM possesses a uniform electron cloud distribution, the lack of effective orbital overlap results in a relatively large energy gap. In contrast, the absence of methyl groups on the phenyl rings of s-TPE reduces steric hindrance, allowing nearly unrestricted rotation of the single bonds. This flexibility enables close proximity between the two phenyl rings connected by the same sp3-C, substantially narrowing the energy gap. Mean- while, Qiu et al. synthesized s-α-TNE, which exhibits an emission peak at ca. 370 nm with a QY of 37.4% (Figure 7c)49. Detailed characterization and analysis revealed that the strong TSC predominantly arises from robust intramolecular interactions between the two naphthyl groups. Notably, the enhanced steric hindrance in s-α-TNE enables the stabilization of intramolecular TSC even in the isolated state, whereas s-TPE-TM and s-TPE require aggregation to achieve comparable TSC stability.
2.3.2 n-Electron structure of aryl subunits
The electronic structure modulation of diarylmethane reveals that introducing n-electrons facilitates the regulation of TSC, leading to long-wavelength emission and high QY. To validate this, our team synthesized two molecules, o-4Py and p-4Py. As shown in Figure 8a, the o-4Py crystal exhibits a broad emission band at 610 nm under varying excitation wavelengths, with a high fluorescence QY of 42%.[41] In contrast, the p-4Py crystal shows negligible emission under the same conditions (Figure 8b). This demonstrates that the position of nitrogen atoms can effectively modulate TSC, thereby tuning emission wavelength and efficiency. Further theoretical calculations on o-4Py (Figure 8c) indicate that when nitrogen atoms are aligned on the same side, the resulting o-4Py(2) and o-4Py(3) exhibit narrow ΔE (2.54 and 2.31 eV, respectively) and long λem,cal (660 and 718 nm, respectively). Conversely, when nitrogen atoms adopt a staggered orientation, o-4Py(1) displays a large ΔE (4.36 eV) and ultraviolet emission (346 nm). These results suggest that proximal placement of nitrogen atoms induces strong TSC. For p-4Py, the strong electronegativity of nitrogen atoms draws electrons toward the periphery, reducing electron density at the molecular center and weakening the TSC.
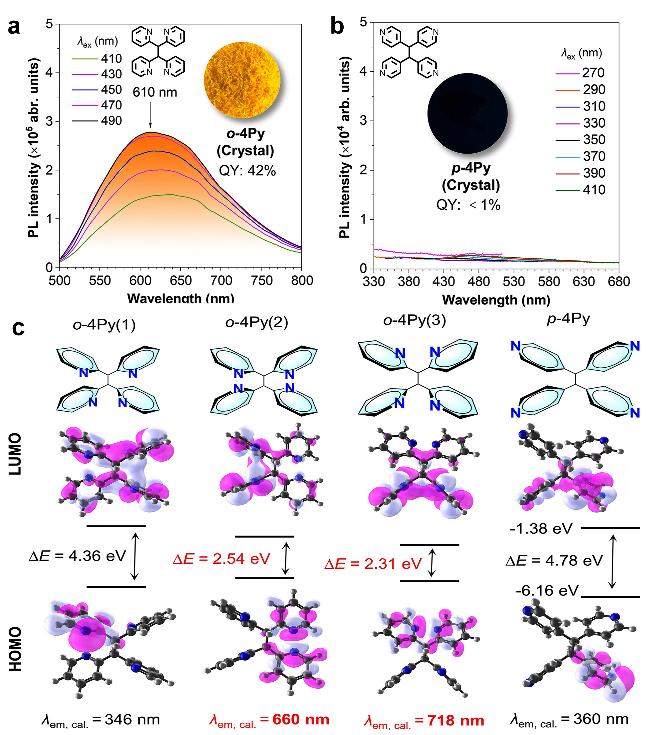
Figure 8 Solid-state PL spectra of (a) o-4Py, (b) p-4Py crystal under different excitation wavelengths (λex); (c) Distribution of electron cloud and energy gap (ΔE) for o-4Py(1), o-4Py(2), o-4Py(3), and p-4Py with 4 nitrogen atoms in different positions of the optimized excited-state conformationReproduced from Ref. [41], copyright 2025 Elsevier |
As mentioned above, the σ-type n-n TSC stabilizes the o-2Md conformation, yielding a smaller bandgap and red-shifted emission. But what role does this σ-type n-n TSC play in o-4Py? Unlike conventional π-π TSC, σ-type n-n TSC exhibits electron delocalization akin to π-bonds, resulting in exceptionally high electron density. We performed ab initio molecular dynamics (AIMD) simulations on the excited-state dynamics of o-4Py(1~3) and p-4Py, using the distance between the two closest nitrogen atoms as a conformational metric. The simulations reveal that n-n TSC in o-4Py(2/3) “locks” the electronic structure like a covalent bond, even surpassing hydrogen-bonding effects and thereby enabling the high solid-state QY observed in o-4Py crystals.[50-52] In summary, n-electron modulation in MAAs is pivotal for elucidating TSC mechanisms and developing high-efficiency luminescent materials governed by TSC.
2.4 Other MAAs
Based on the above research, TSC mainly involves three types: π-π, n-π and n-n TSC, and is significantly influenced by both intermolecular and intramolecular forces. But does the distance between aromatic rings within a molecule affect its luminescent properties? To explore this question, our team designed a series of non-conjugated tetraphenylalkanes (TPAs) with varying alkyl chain lengths (from methane to heptane).[53-55] We found that these TPAs exhibit an excited-state odd-even effect: TPAs with an even number of alkyl carbons showed strong TSC, long-wave- length emission, and high quantum yield, while those with an odd number of alkyl carbons were almost non-emissive, with negligible QYs (Figure 9a). Furthermore, we investigated the single-molecule flexibility of these TPAs using the RMSD parameter. As shown in Figure 9b, the RMSD values increased from 0.0054 nm for C1-TPA to 0.0721 nm for C5-TPA, indicating greater molecular flexibility with longer alkyl chains. However, when the chain length increased further, the RMSD values for C6-TPA and C7-TPA decreased to 0.0383 and 0.0342 nm, respectively, suggesting that their conformations became more rigid. Given that C1~C5 TPAs differ in structures and properties from C6-TPA and C7-TPA, they were analyzed separately.
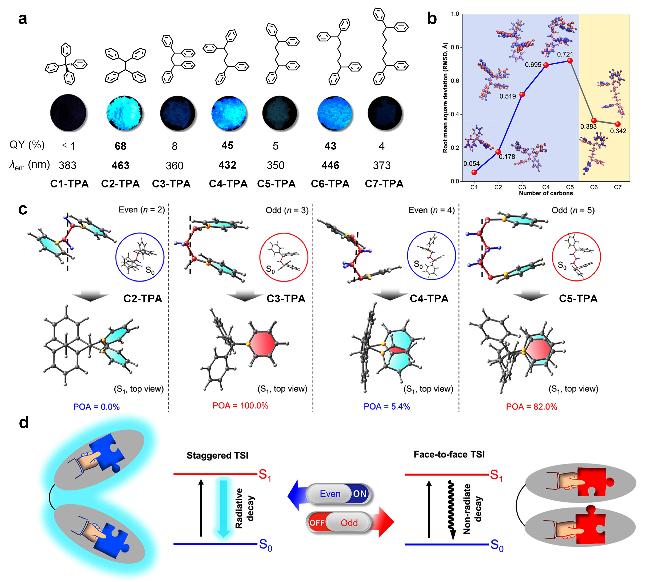


Figure 9 (a) Molecular structures and solid-state fluorescence images of C1-TPA to C7-TPA; (b) RMSD plot of TPAs with varying alkyl chain lengths; (c) Intramolecular staggered and face-to-face packing structures of C2-TPA to C5-TPA; (d) Schematic illustration of the switching between different photophysical processes associated with the excited-state odd-even effectReproduced from Ref. [53], copyright 2023 American Chemical Society |
The percentages of overlapping area (POA) between adjacent phenyl rings for C2-, C3-, C4-, and C5-TPA are shown in Figure 9c as 0%, 100%, 5.4%, and 82%, respectively. Even-carbon TPAs such as C2-TPA and C4-TPA exhibit a staggered intramolecular packing structure, where adjacent phenyl rings are close but not in a face-to-face geometry, with minimal overlap (0% and 5.4%). In contrast, odd-carbon TPAs like C3-TPA and C5-TPA adopt face-to-face conformations, with significantly higher overlap (100% and 82%), which correlates with their photophysical behavior. Upon closer structural analysis, we found that the arrangement of the two adjacent phenyl rings depends on the orientation of the terminal methyl groups. In C3-TPA and C5-TPA, the two terminal methyl groups are located on the same side, causing the adjacent phenyl rings to pack tightly in a face-to-face mode. In C2-TPA and C4-TPA (with even alkyl carbons), the two terminal methyl groups are on opposite sides, keeping the phenyl rings relatively distant and forming a staggered TSC. However, C1-TPA has larger intramolecular steric hindrance compared to TPAs with longer chains, and although it also forms a staggered TSC, its rigid conformation weakens this interaction, resulting in almost no luminescence.
C6-TPA, similar to C4-TPA, also exhibits a staggered conformation, but the distance between the two DPM (diphenylmethane) segments is relatively long, preventing the formation of intramolecular TSC. However, its rigid structure favors strong intermolecular π-π interactions. Therefore, in C6-TPA, intermolecular TSC plays a more dominant role in its luminescence than intramolecular effects. C7-TPA is difficult to crystallize, suggesting that alkyl chains with an odd number of carbon atoms do not facilitate orderly intermolecular stacking. This implies that the consistent orientation of terminal DPM groups on the same side may hinder close molecular packing. Thus, the excited-state odd-even effect in C6-TPA and C7-TPA can be attributed to differences in their intermolecular TSC rather than intramolecular interactions.
3 Summary and outlook
This account systematically summarizes the recent advances in the TSC mechanism within MAAs small-mole- cule systems, with a focus on three key regulatory strategies: conformation, D-A and n-electron structure of aryl subunits. Our studies demonstrate that in conformation modulation and D-A electronic structure design, the π-π TSC mechanism significantly enhances TSC by optimizing intra- and intermolecular interactions, effectively suppress- ing molecular motion and increasing structural rigidity, resulting in QY of up to 100%. However, the emission wavelength remains confined below 470 nm. In contrast, within heteroatom-doped systems, the n-π TSC between lone-pair electrons of heteroatoms and aromatic rings, as well as the σ-type n-n TSC between lone-pair electrons, collectively form efficient TSC channels. This not only induces a significant redshift in the emission wavelength of WILMs to 700 nm but also achieves a QY as high as 25%. These indicates that WILMs are expected to be comparable to traditional organic luminescent materials. Therefore, this account not only provides a systematic theoretical framework for understanding the TSC mechanism in MAAs, but also offers molecular engineering strategies that chart a clear path for developing a new generation of highly efficient, stable, and tunable WILMs, thereby driving innovation in the field.
However, despite significant progress in understanding the TSC mechanism of MAAs small molecules, several critical challenges remain: (1) Current research lacks a quantitative understanding of the synergistic relationship between π-π, n-π, and n-n TSC in MAAs. The structure-property relationship between heteroatom types, positions, and TSC efficiency requires deeper investigation, and universal design principles are still lacking. (2) Existing characterization techniques are insufficient for real- time observation of the dynamic formation processes of TSC. Therefore, we still need some cutting-edge techniques to directly “see” or visualize the TSC. We believe that by deepening the mechanistic study of TSC and developing precise regulatory strategies, it will be possible to advance the practical applications of highly efficient, stable, and tunable WILMs in OLEDs, bioimaging, sensing, and other fields.
(Li, L.)