1 结果与讨论
1.1 探针的合成与筛选
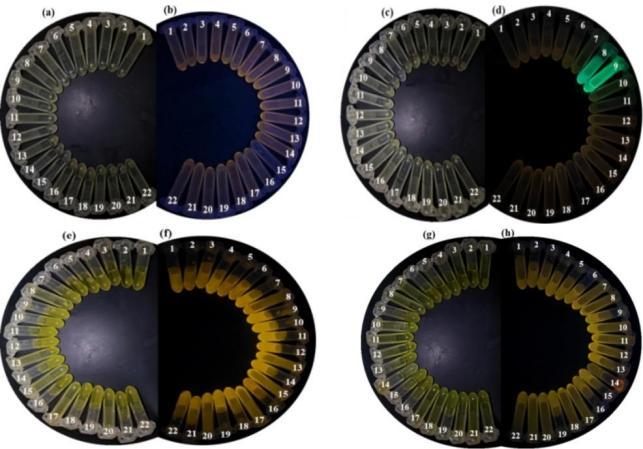
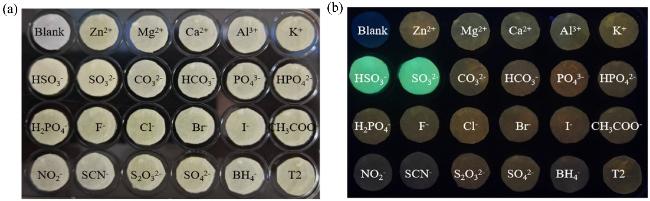
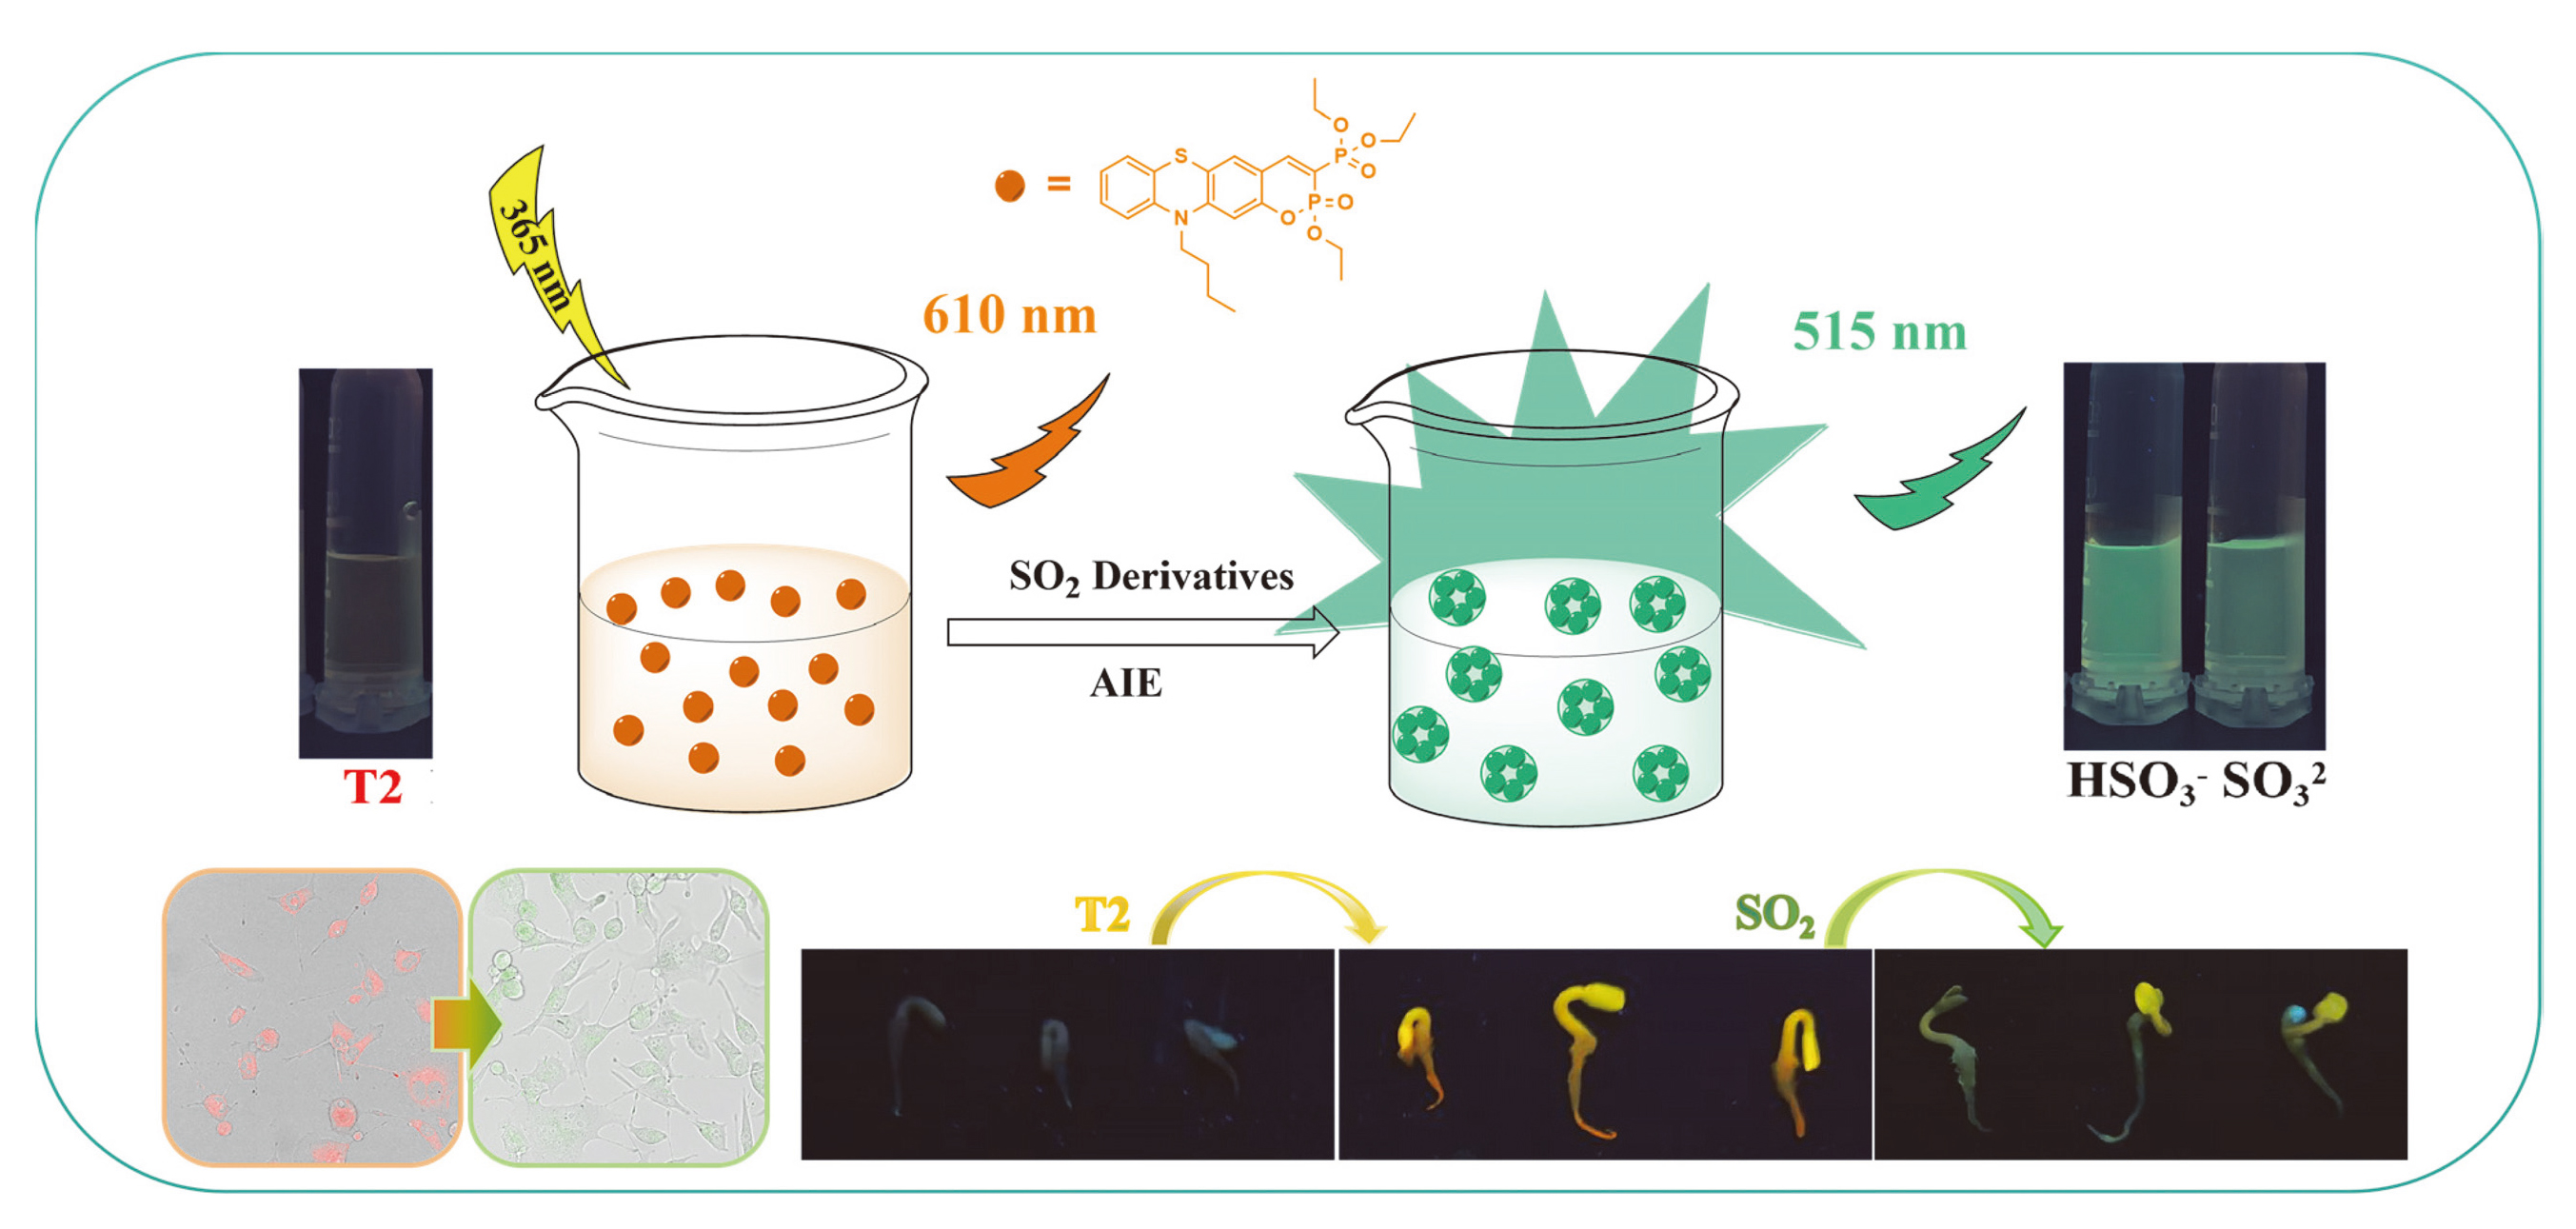
图1 探针T1 (a, b)、探针T2 (c, d)、探针T3 (e, f)和探针T4 (g, h)中加入不同分析物的日光(左)和365 nm紫外光下(右)照片Figure 1 Photographs of probes T1 (a, b), T2 (c, d), T3 (e, f), and T4 (g, h) in the absence and presence of various analytes under daylight (left) and 365 nm UV irradiation (right) 1~22: probe, ${\text{PO}}_{4}^{3-}$, ${\text{HPO}}_{4}^{2-}$, ${\text{H}}_{2}{\text{PO}}_{4}^{-}$, ${\text{CO}}_{3}^{2-}$, ${\text{HCO}}_{3}^{-}$, ${\text{S}}_{2}{\text{O}}_{3}^{2-}$, ${\text{SO}}_{3}^{2-}$, ${\text{HSO}}_{3}^{-}$, ${\text{SO}}_{4}^{2-}$, F-, Cl-, Br-, I-, AcO-, ${\text{BH}}_{4}^{-}$, SCN-, ${\text{NO}}_{\text{2}}^{-}$, Zn2+, Mg2+, Al3+, Ca2+. |
1.2 探针T2对$HS{O}_{3}^{-}{\text{/SO}}_{3}^{2-}$的选择性和抗干扰性的研究
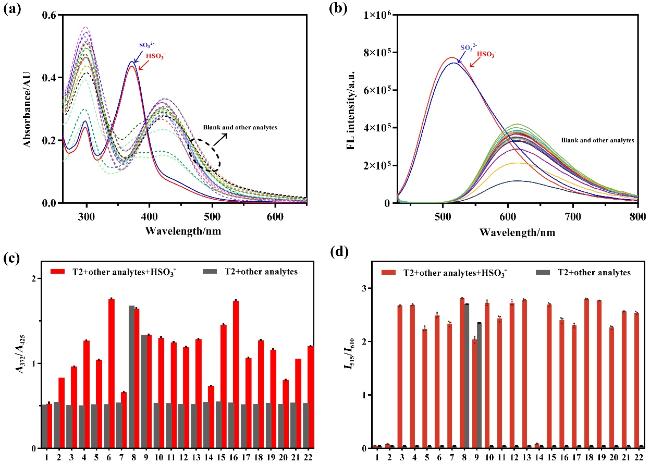
图2 T2 (20 μmol/L)在纯水溶液中: 加入1.0 equiv.分析物后T2的(a)紫外吸收光谱变化和(b)荧光光谱变化; (c)在比值(A372/A425)下T2与${\text{HSO}}_{3}^{-}$/${\text{SO}}_{3}^{2-}$的紫外-可见光谱竞争实验; (d)在比值(I515/I610)下T2与${\text{HSO}}_{3}^{-}$/${\text{SO}}_{3}^{2-}$的荧光光谱竞争实验Figure 2 T2 (20 μmol/L) in pure aqueous solution: (a) UV absorption spectral changes, and (b) fluorescence spectral changes of T2 upon addition of 1.0 equiv. analyte; (c) UV-Vis spectral competition experiment of T2 with ${\text{HSO}}_{3}^{-}$/${\text{SO}}_{3}^{2-}$ at the ratio (A372/A425); (d) Fluorescence spectral competition experiment of T2 with ${\text{HSO}}_{3}^{-}$/${\text{SO}}_{3}^{2-}$ at the ratio (I515/I610) 1~22: probe, ${\text{PO}}_{4}^{3-}$, ${\text{HPO}}_{4}^{2-}$, ${\text{H}}_{2}{\text{PO}}_{4}^{-}$, ${\text{CO}}_{3}^{2-}$, ${\text{HCO}}_{3}^{-}$, ${\text{S}}_{2}{\text{O}}_{3}^{2-}$, ${\text{SO}}_{3}^{2-}$, ${\text{HSO}}_{3}^{-}$, ${\text{SO}}_{4}^{2-}$, F-, Cl-, Br-, I-, AcO-, ${\text{BH}}_{4}^{-}$, SCN-, ${\text{NO}}_{\text{2}}^{-}$, Zn2+, Mg2+, Al3+, Ca2+. |
1.3 探针T2对$HS{O}_{3}^{-}$的敏感性的研究
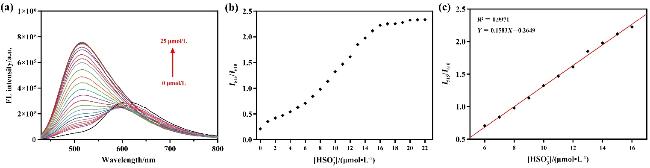
图3 (a) 0~25 μmol/L ${\text{HSO}}_{3}^{-}$处理后T2在水溶液中的荧光光谱变化; (b)在水溶液中探针T2 (20 μmol/L)与添加${\text{HSO}}_{3}^{-}$ (0~22 μmol/L)后的荧光强度比(I515/I610); (c)荧光强度比(I515/I610)与${\text{HSO}}_{3}^{-}$ (6~16 μmol/L)浓度的线性关系Figure 3 (a) Fluorescence spectral changes of T2 in aqueous solution upon treatment with increasing concentrations of ${\text{HSO}}_{3}^{-}$ (0~25 μmol/L); (b) Plot of the fluorescence intensity ratio (I515/I610) of probe T2 (20 μmol/L) versus ${\text{HSO}}_{3}^{-}$ concentration (0~22 μmol/L) in aqueous solution; (c) Linear relationship between I515/I610 and ${\text{HSO}}_{3}^{-}$ concentration in the range of 6~16 μmol/L |
1.4 相对荧光量子产率的测定及探针T2对$HS{O}_{3}^{-}$的响应时间的研究
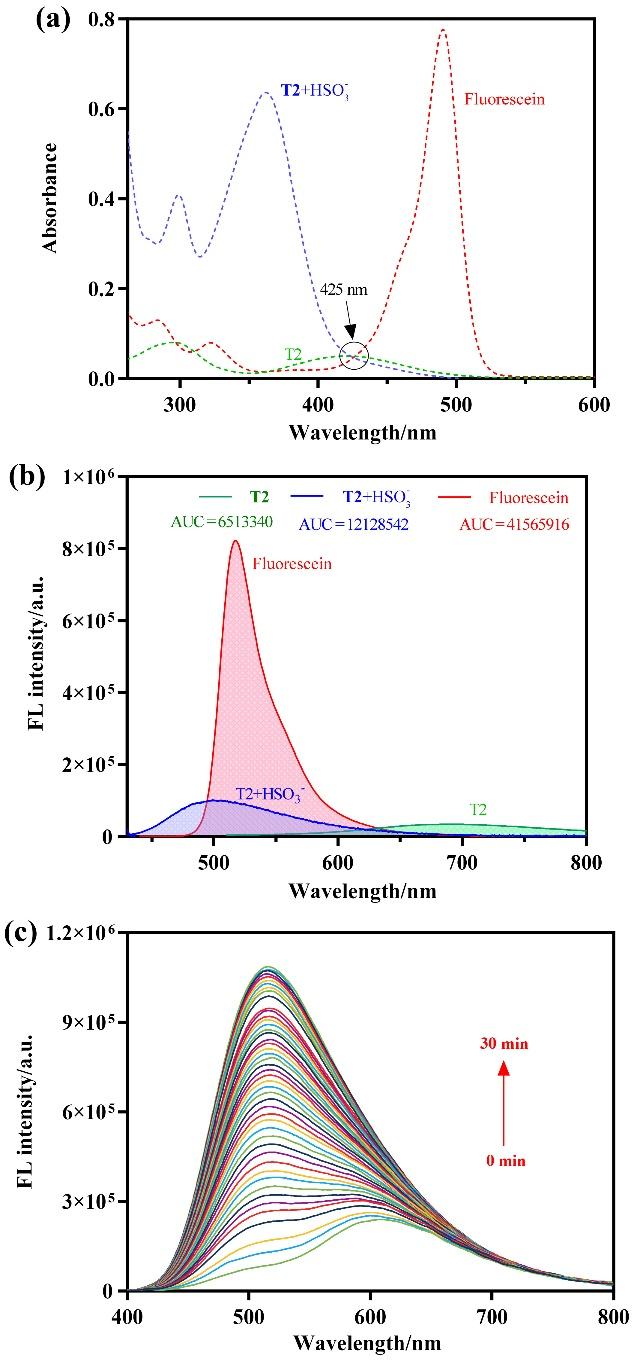
图4 (a) T2、T2-${\text{HSO}}_{3}^{-}$及参比物质荧光素(Fluorescein)在室温水溶液中的紫外-可见吸收光谱(虚线箭头标注为用于荧光测试的激发波长, 425 nm); (b)相同条件下各待测物在425 nm激发下的荧光发射光谱(荧光素溶于0.1 mol/L NaOH水溶液, T2和T2-${\text{HSO}}_{3}^{-}$溶于水, 图中标注为各光谱的积分面积, AUC); (c)加入1.0 equiv. ${\text{HSO}}_{3}^{-}$后探针T2溶液的荧光强度随时间变化光谱图(λex=425 nm)Figure 4 (a) Ultraviolet-visible absorption spectra of T2, T2- ${\text{HSO}}_{3}^{-}$, and the reference substance fluorescein in aqueous solution at room temperature (The dashed arrows indicate the excitation wavelength, 425 nm) used for the fluorescence assay; (b) Fluorescence emission spectra of each analyte under the same conditions at 425 nm excitation (Fluorescein was dissolved in 0.1 mol/L NaOH aqueous solution, while T2 and T2-${\text{HSO}}_{3}^{-}$ were dissolved in water. The spectra were labeled with their respective integral areas, AUC); (c) Fluorescence intensity time-dependent spectrum of probe T2 solution after addition of 1.0 equiv. ${\text{HSO}}_{3}^{-}$ (λex=425 nm) |
表1 探针T2及其亚硫酸氢盐加合物的相对荧光量子产率Table 1 Relative fluorescence quantum yield of probe T2 and its bisulfite adduct |
| Sample | Excitation wa- velength/nm | Absorbance (A425 nm) | Area under the curve | Φx/% |
|---|---|---|---|---|
| Fluorescein | 425 | 0.045675 | 41565916 | 92.0% |
| T2 | 425 | 0.050134 | 6513340 | 13.1% |
| T2+${\text{HSO}}_{3}^{-}$ | 425 | 0.047588 | 12128542 | 25.8% |
1.5 探针T2识别$HS{O}_{3}^{-}$的机理讨论
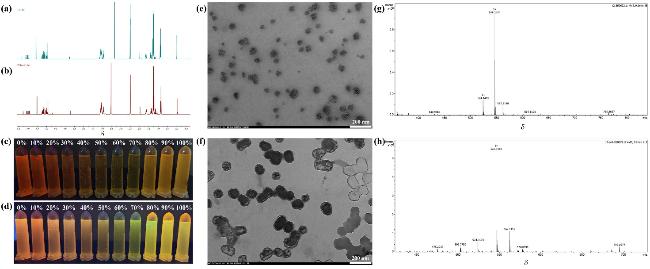
图5 (a)探针T2的1H NMR (DMSO-d6); (b)探针T2响应${\text{HSO}}_{3}^{-}$后的1H NMR (DMSO-d6); (c) 365 nm紫外灯下T2 (10 μmol/L)在不同水分数(fw)的DMSO/H2O混合物中的荧光图; (d) 365 nm紫外灯下T2 (10 μmol/L)在添加${\text{HSO}}_{3}^{-}$(10 μmol/L)后在不同水分数(fw)的DMSO/H2O混合物中的荧光效应; (e)探针T2在水溶液中的TEM图; (f)探针T2与${\text{HSO}}_{3}^{-}$响应后水溶液的TEM图; (g)水相中探针T2的HRMS; (h)水相中探针T2响应${\text{HSO}}_{3}^{-}$后的HRMSFigure 5 (a) 1H NMR spectrum of probe T2 in DMSO-d6; (b) 1H NMR spectrum of probe T2 after reaction with ${\text{HSO}}_{3}^{-}$ in DMSO-d6; (c) Fluorescence effect of T2 (10 μmol/L) in DMSO/H2O mixtures with different water fractions (fw) under a 365 nm UV lamp; (d) Fluorescence images of T2 (10 μmol/L) upon addition of ${\text{HSO}}_{3}^{-}$ (10 μmol/L) in DMSO/H2O mixtures with different water fractions (fw) under a 365 nm UV lamp; (e) TEM image of probe T2 in aqueous solution; (f) TEM image of the aqueous solution of probe T2 after reaction with ${\text{HSO}}_{3}^{-}$; (g) HRMS spectrum of probe T2 in water; (h) HRMS spectrum of probe T2 after reaction with ${\text{HSO}}_{3}^{-}$ in water |
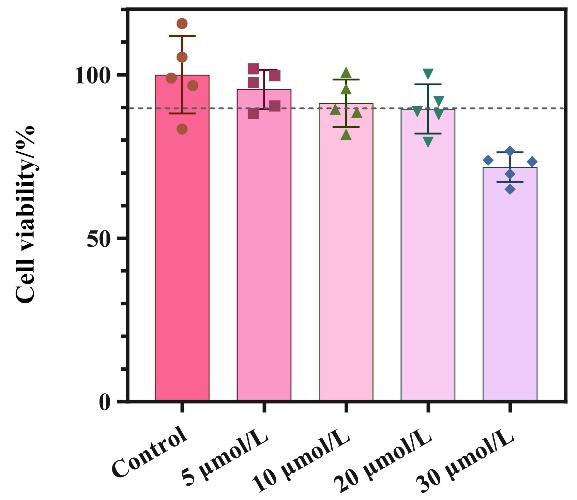
1.6 探针T2安全性实验
1.7 探针T2对活细胞中$HS{O}_{3}^{-}$成像
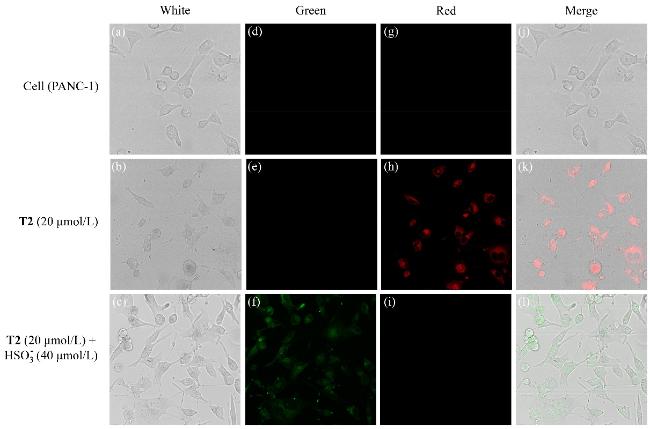
图7 PANC-1细胞在37 ℃下加入T2 (20 μmol/L)再加入${\text{HSO}}_{3}^{-}$ (40 μmol/L)孵育后的荧光图Figure 7 Fluorescence images of PANC-1 cells incubated with T2 (20 μmol/L) at 37 ℃ followed by the addition of ${\text{HSO}}_{3}^{-}$ (40 μmol/L) Bright field (a, b, c), green channel (d, e, f), red channel (g, h, i), and merged images (j, k, l) |
1.8 探针T2在植物的成像的研究
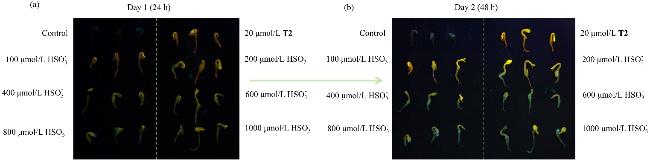
图8 用探针T2 (20 μmol/L)和不同浓度的NaHSO3溶液处理的芝麻幼苗: (a)处理24 h后365 nm紫外灯下的图像; (b)处理48 h后365 nm紫外灯下的图像Figure 8 Sesame seedlings treated with probe T2 (20 μmol/L) and different concentrations of NaHSO3 solution: (a) Images under 365 nm UV lamp after 24-hour treatment; (b) Images under 365 nm UV lamp after 48-hour treatment |